Tutorial on miRTargetLink 2.0
Sections
Input page
In order for miRTargetLink to generate an interaction network either a set of miRNAs, genes or both must be provided.
Let's have a look first at Unidirectional search where you can query the network for either miRNAs or target genes.
Unidirectional search
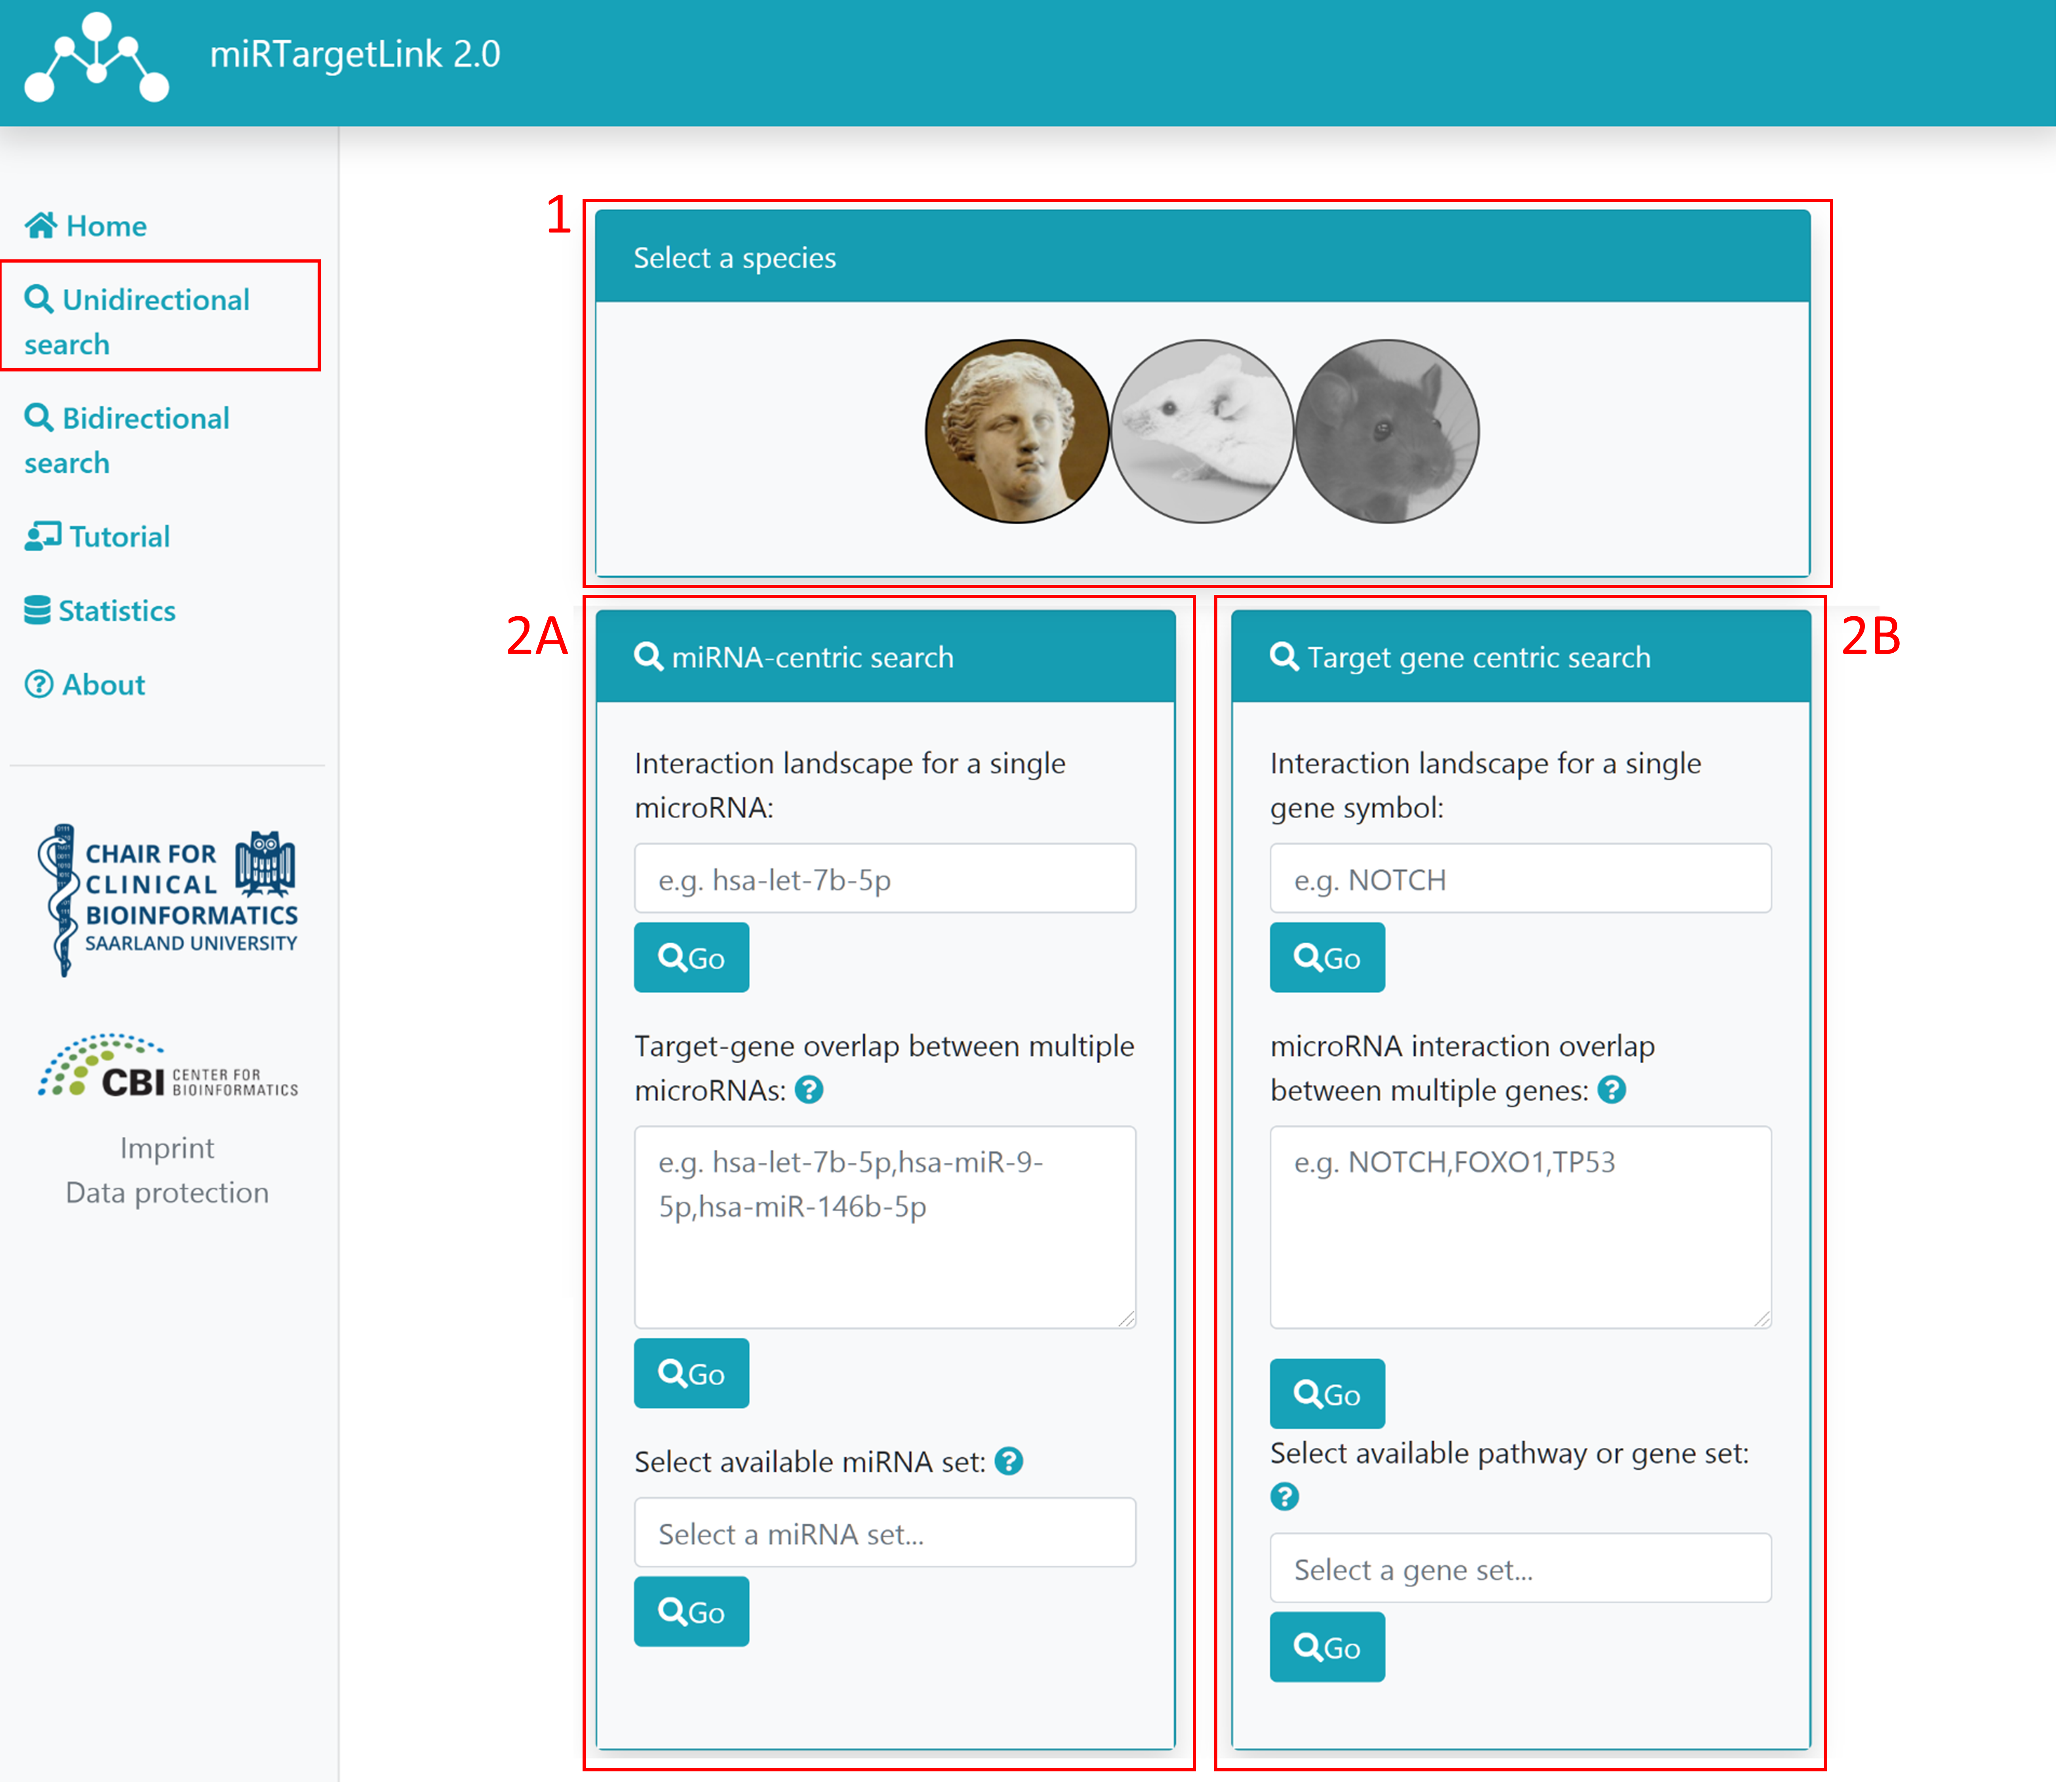
Step 1: Select your desired species
Step 2: Select miRNA-centric (A) or target gene centric (B) search (mutually exclusive)
2A: If you want to use miRNA terms to generate the network, you have 3 choices. Please note that these are mutually exclusive.
- Single miRNA input: once you start typing, miRNA names for the selected species will be suggested. Click on the desired miRNA to choose it and then click on "Go"
- Multiple miRNA input: users can also input several comma-separated miRNA names and then click on "Go". If any of the provided names is ambiguous (more than one miRNA matches a term) a page for search refinement will appear.
-
miRNA set or pathway: instead of providing the full list of miRNAs users can also choose a miRNA set from
miEAA or pathway from miRPathDB.
This querying strategy can be used to spawn networks involving age- or gender-associated miRNAs, which could be relevant for a number of analysis or to identify possible confounders.
2B: Similarly to 2A, there are 3 mutually exclusive choices to search using gene symbols
- Single gene input: once you start typing, gene symbols for the selected species will be suggested. Click on the desired gene to choose it and then click on "Go"
- Multiple gene input: users can also input several comma-separated gene symbols and then click on "Go". If any of the provided names is ambiguous (more than one gene matches a term) a page for search refinement will appear.
- gene set or pathway: instead of providing the full list of genes users can also choose a gene set from GeneTrail or a pathway.
Bidirectional search
It can also be the case that some users are interested in providing a specific set of miRNAs and target genes.
If that's the case they can use Bidirectional search.
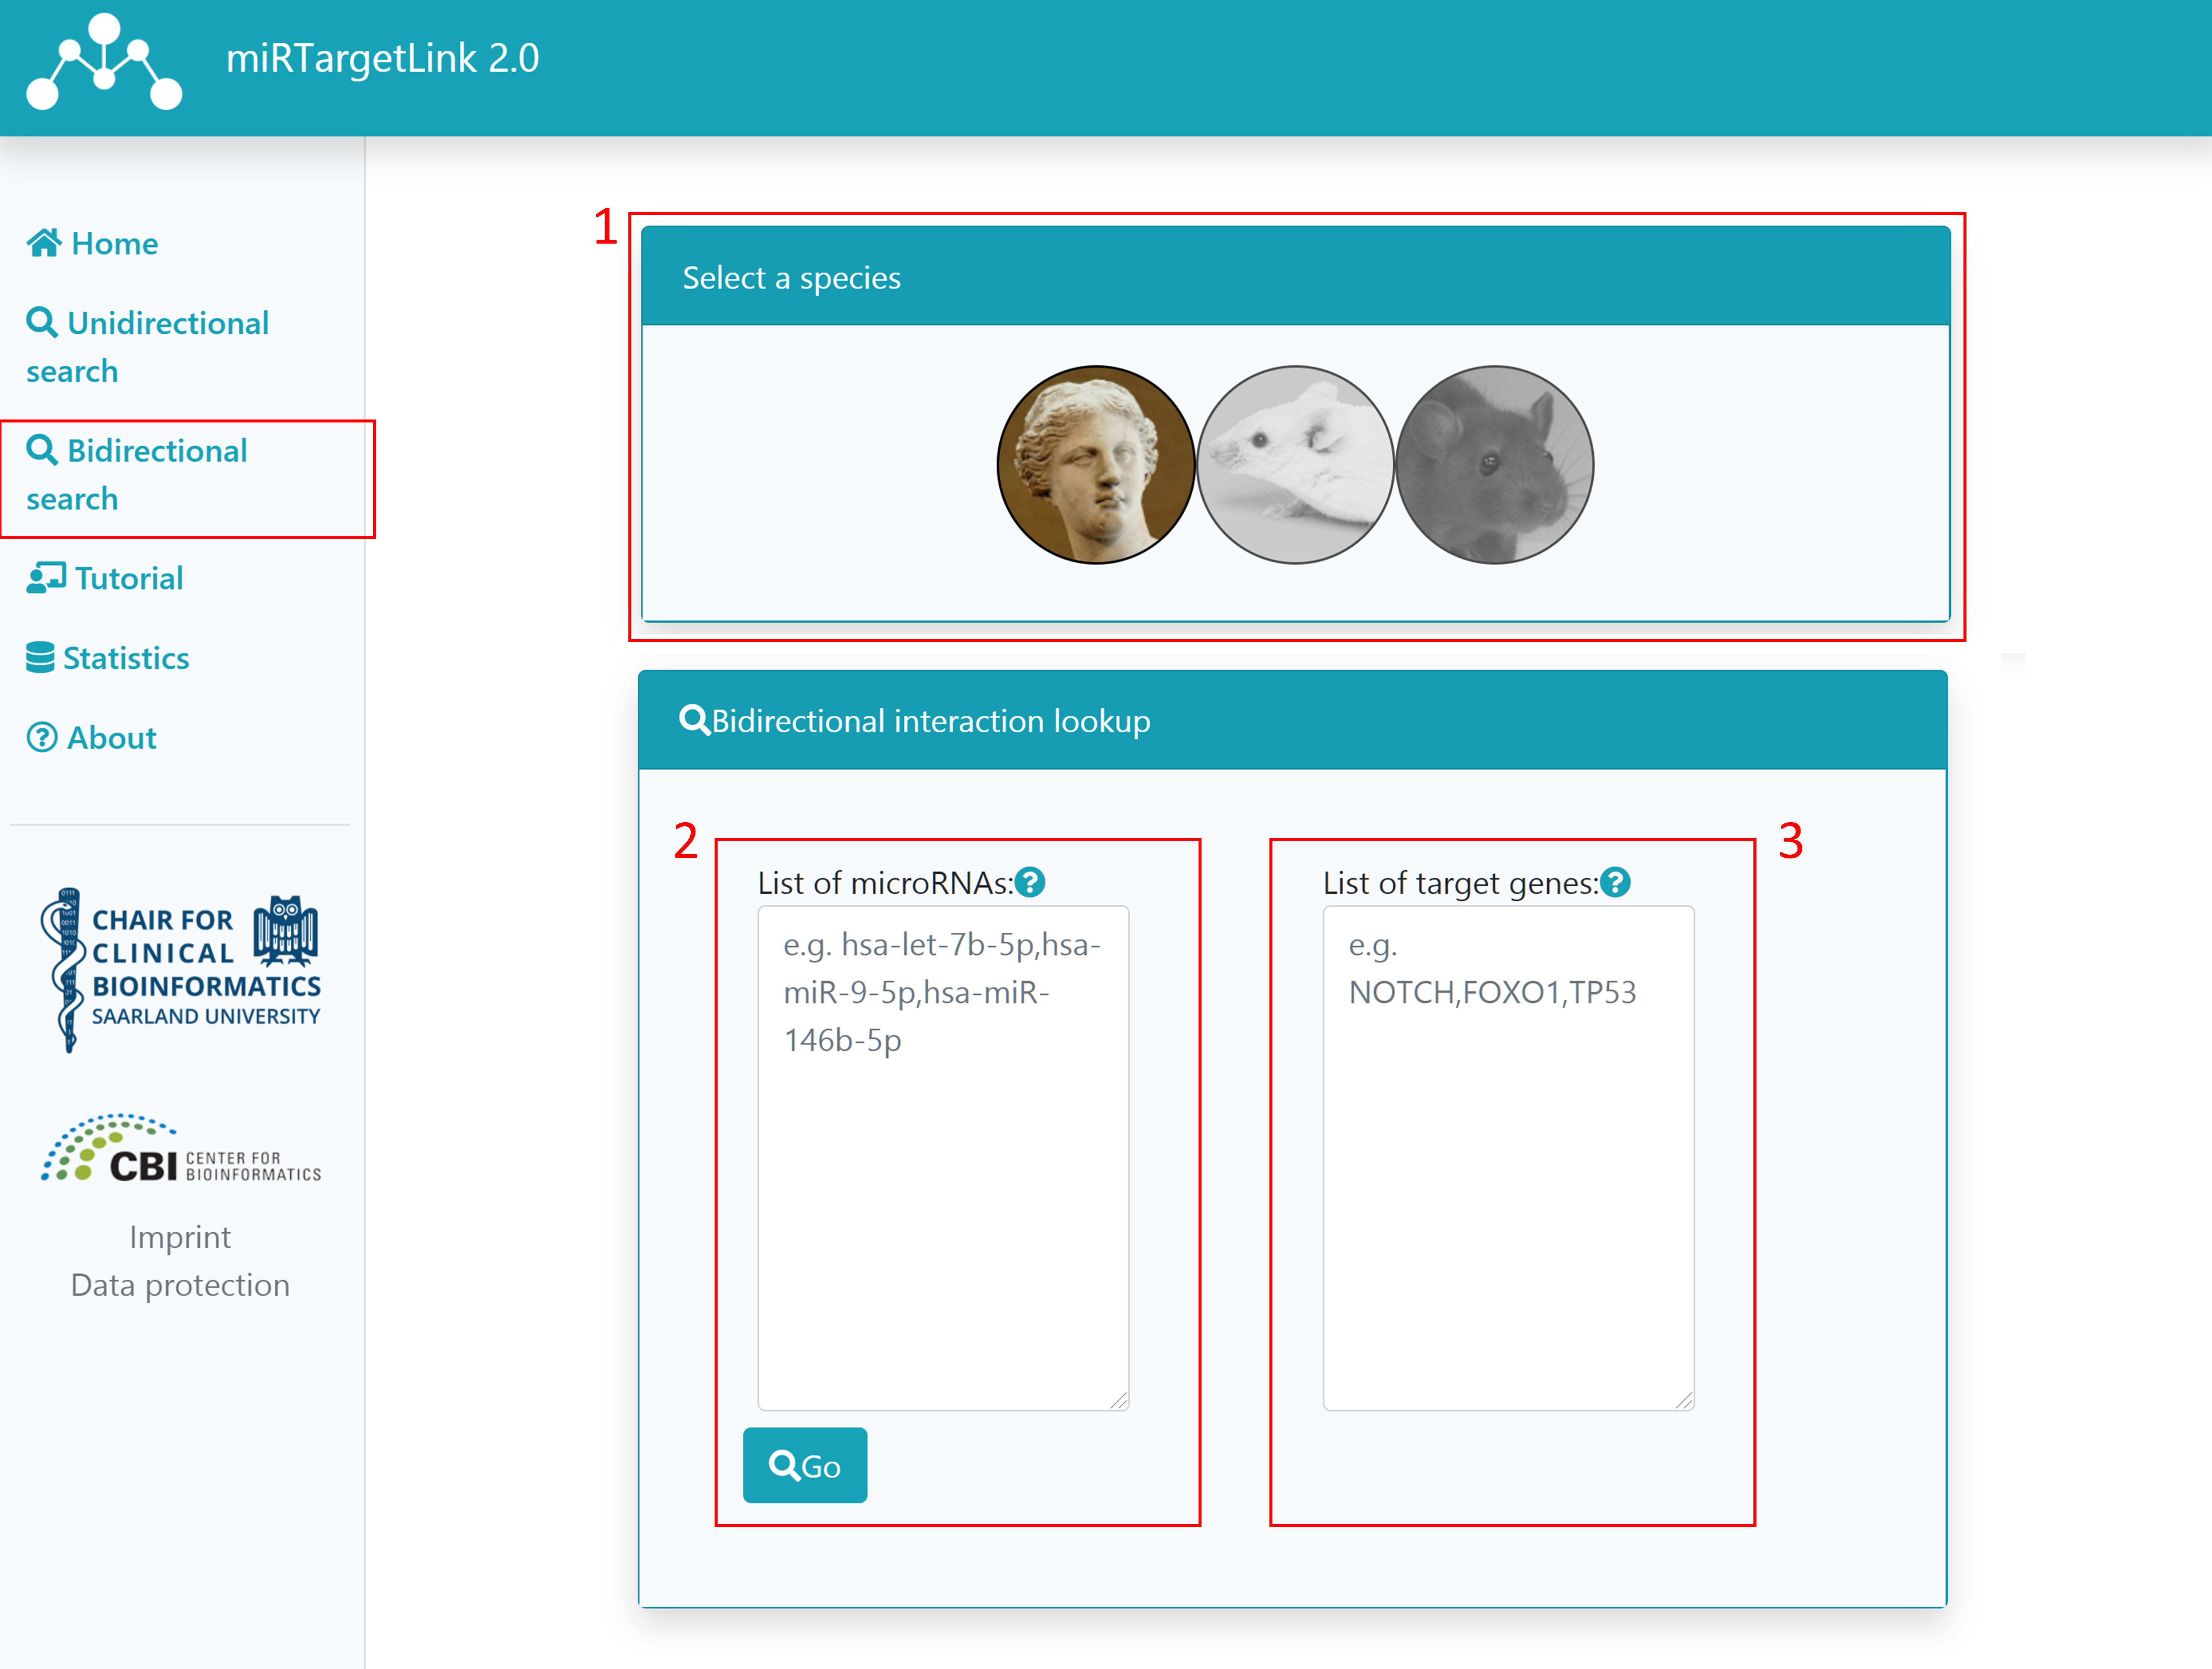
Step 1: Select your desired species
Step 2: Type or paste a list of miRNA names that you want to include in the network. They must be provided comma-delimited. If any of the provided names is ambiguous (more than one miRNA matches a term) a page for search refinement will appear.
Step 3: Type or paste a list of gene symbols that you want to include in the network. They must be provided comma-delimited. If any of the provided symbols is ambiguous (more than one gene matches a term) a page for search refinement will appear.
Step 4: Click on "Go".
Network view
Once the query has been submitted, a result page containing a network visualization is generated.
Overview
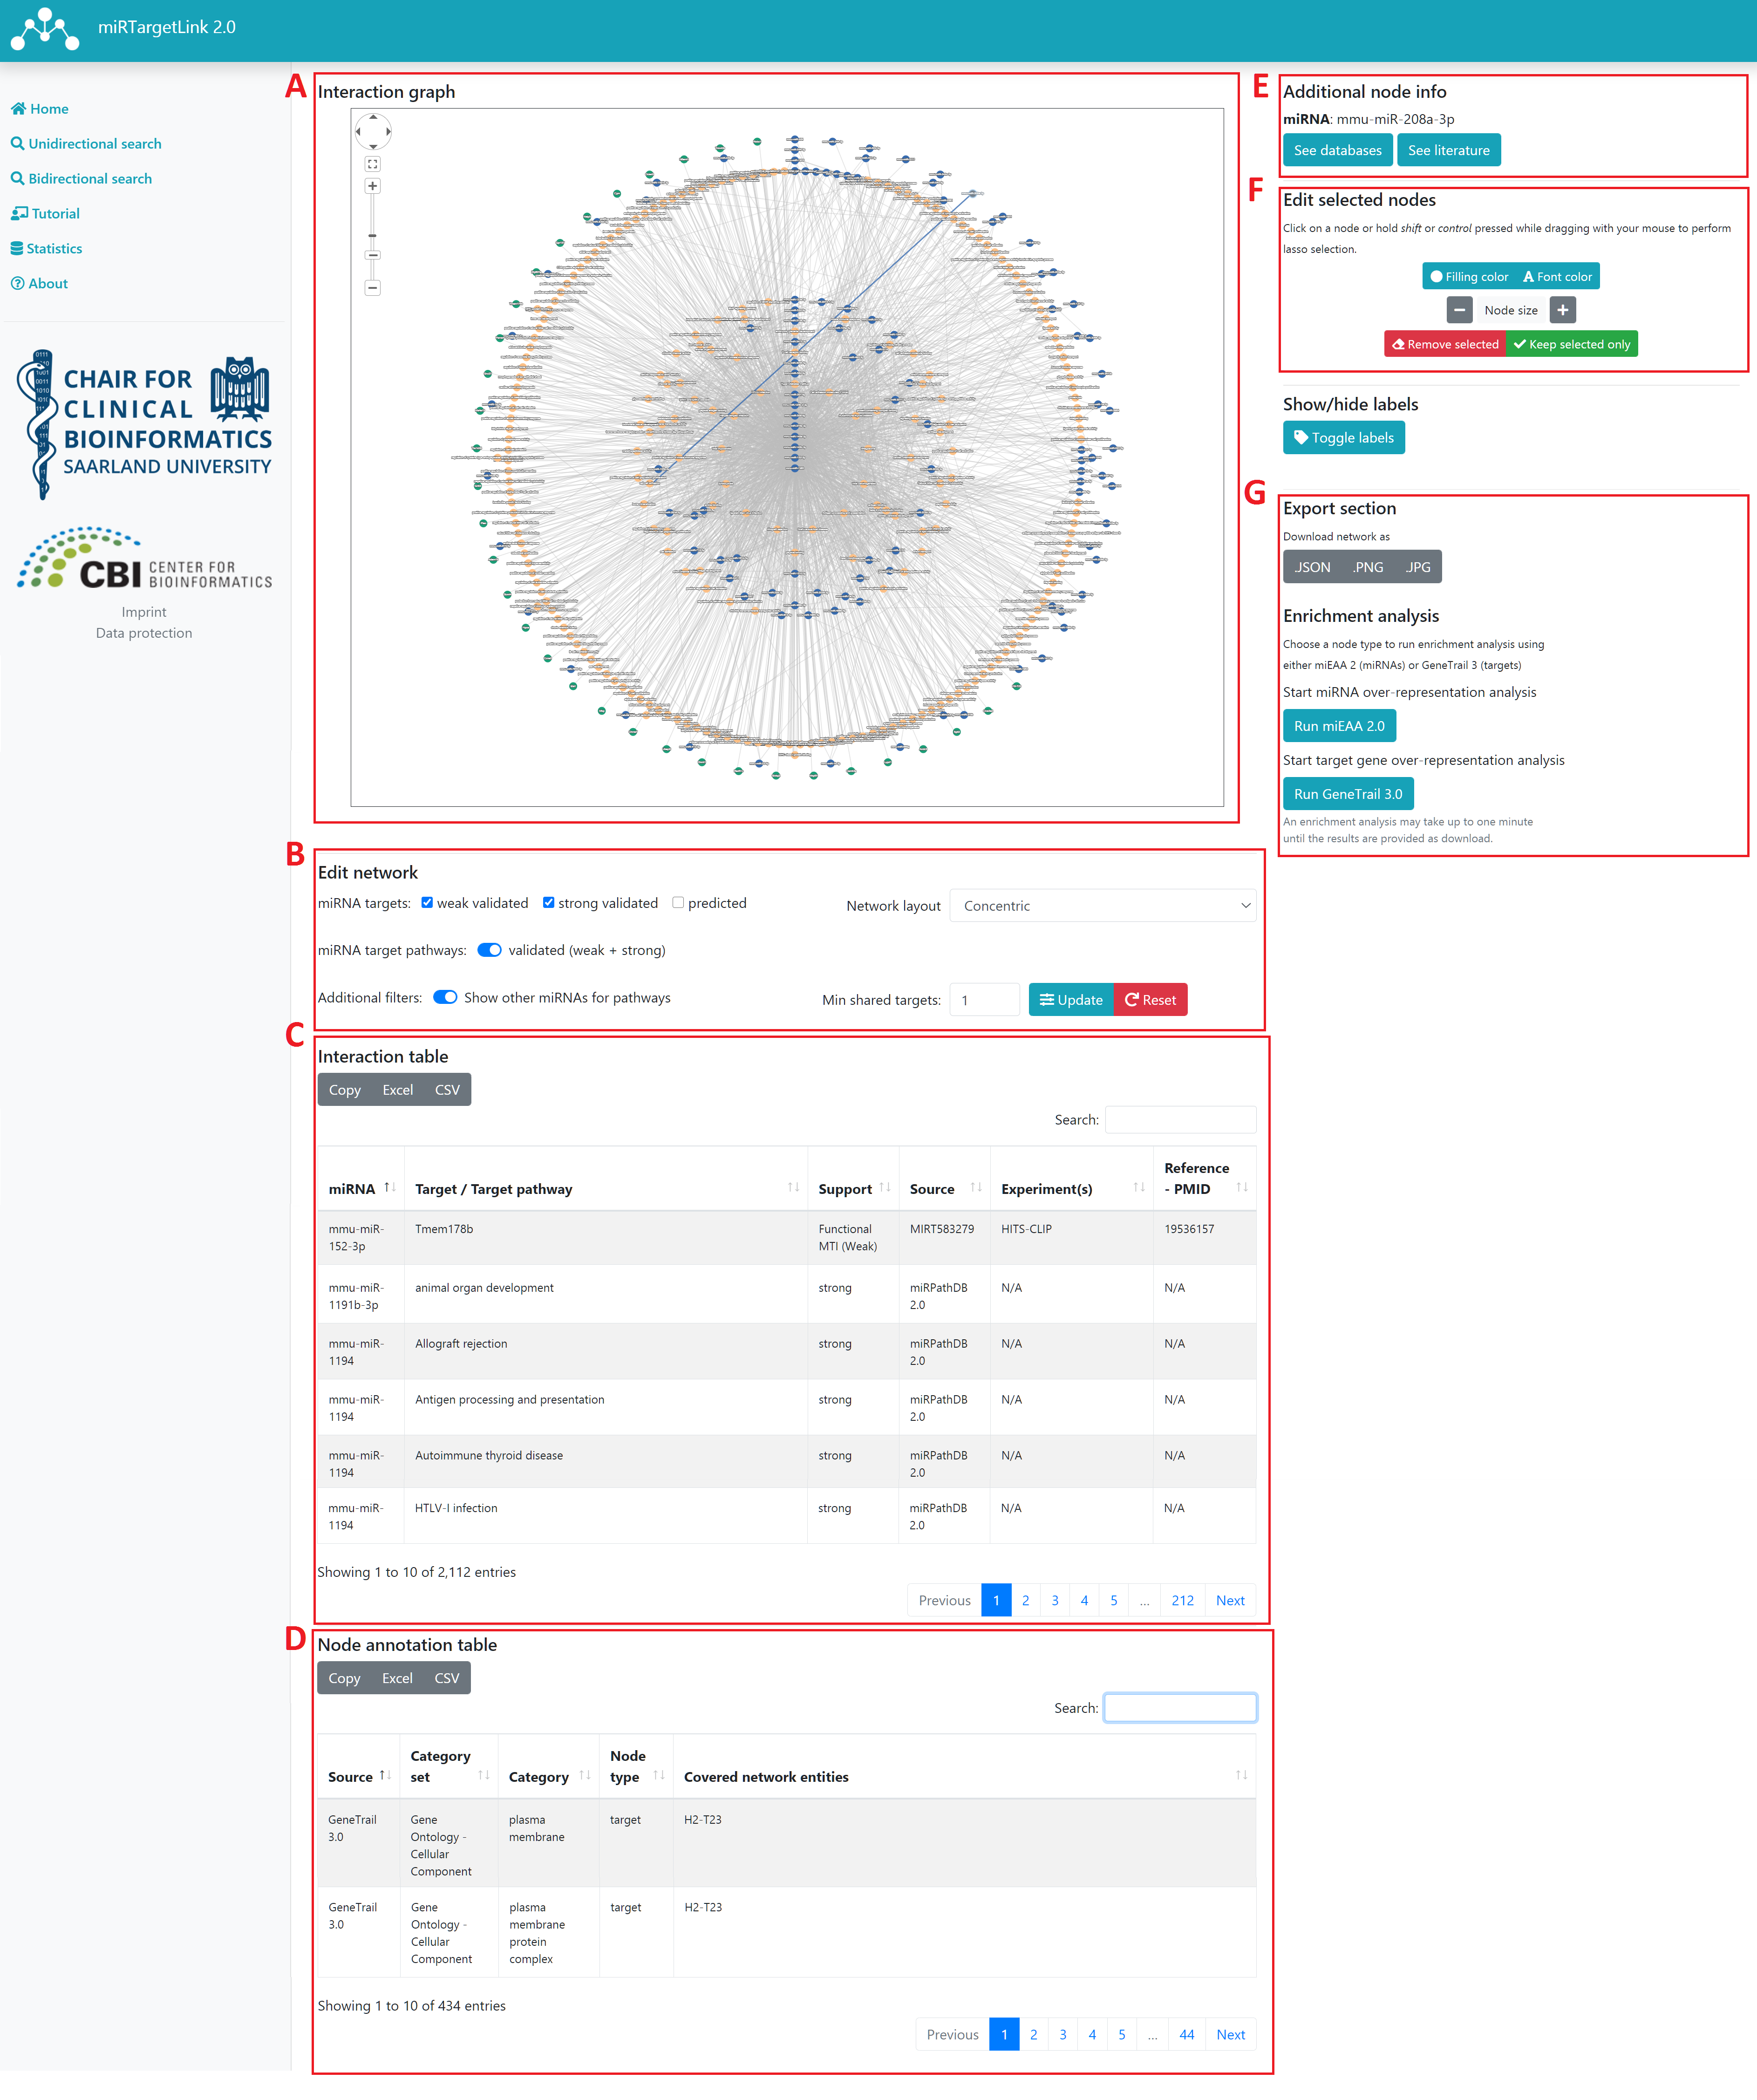
There are 4 sections in the results page:
Interaction graph
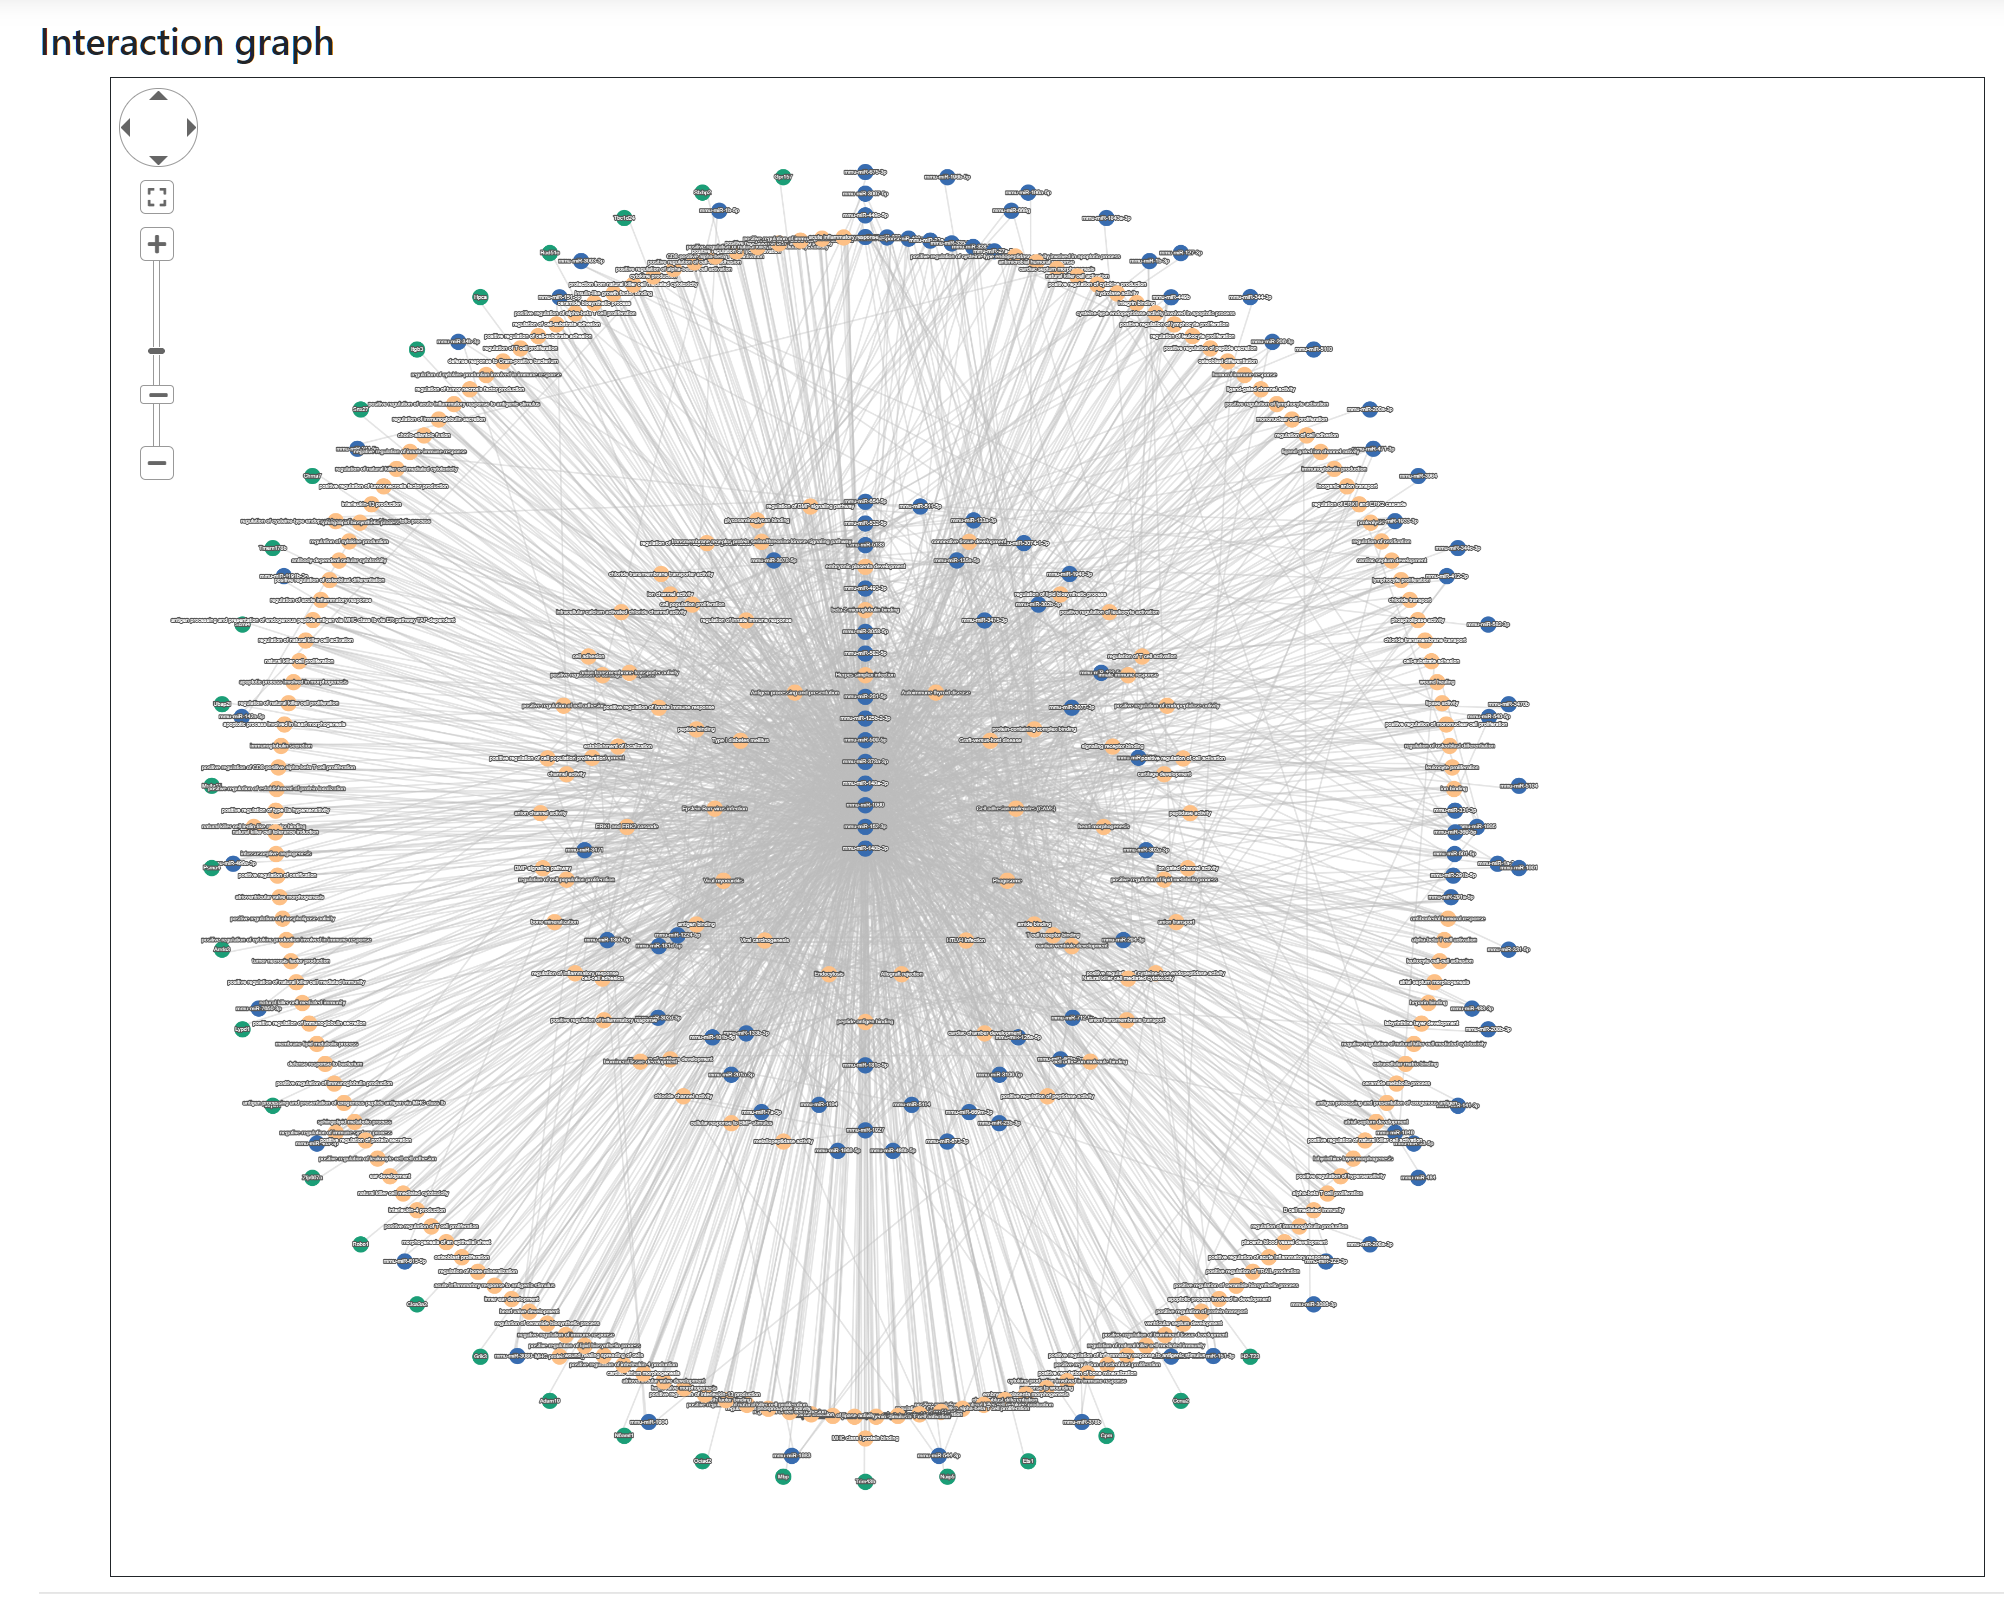
This is the main section where users can explore the relationships between the nodes contained in the generated network. The content of the network is determined by the query from the input pages, but users can include, exclude or edit their network by using the parameters provided in the Edit network section.
Nodes represent miRNAs, target genes and target pathways whereas the edges joining them represent validated (with strong or weak evidence) and predicted targeting.
Users can pan, zoom and reposition the nodes of the generated network. To do this they can either use their mouse (click on the background, scroll button or click on the nodes) or the navigation panel at the top left corner of the graph view.
Nodes can also be selected to highlight them together with connecting edges. A node can be selected by clicking on it and more nodes can be added to the selection if the Ctrl key is held down. Pressing down the Shift key will activate a lasso selection.
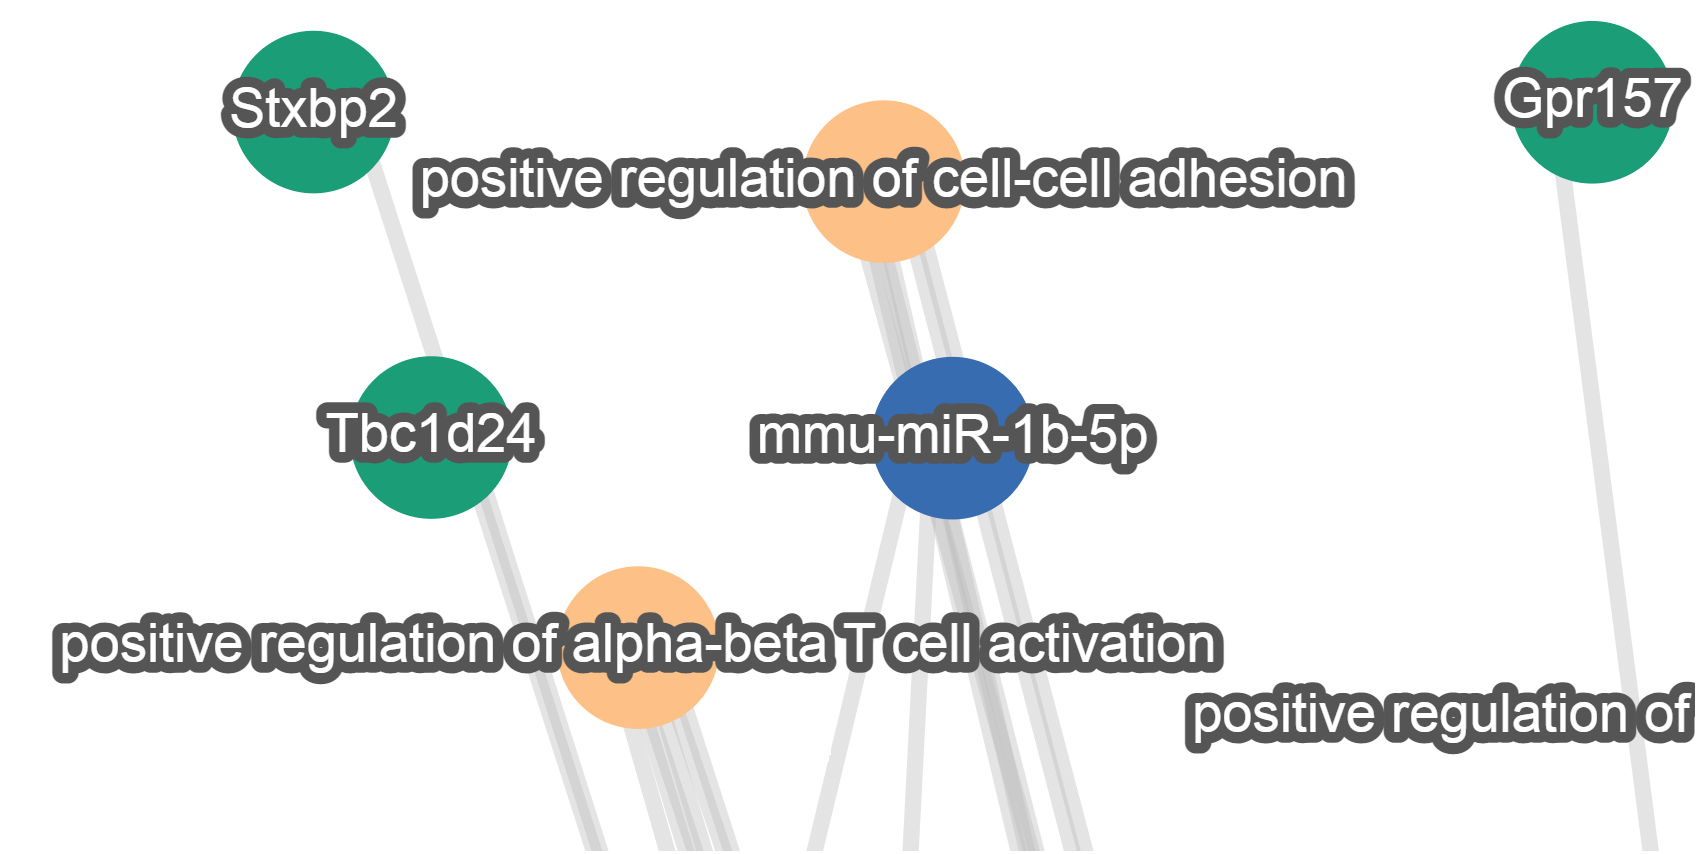
Nodes are represented as circles with varying filling colors depending on the category of the element they represent: blue is used for miRNAs, green for target genes and orange for target pathways.
The name of each element is provided as label on top of each node.
Edit network
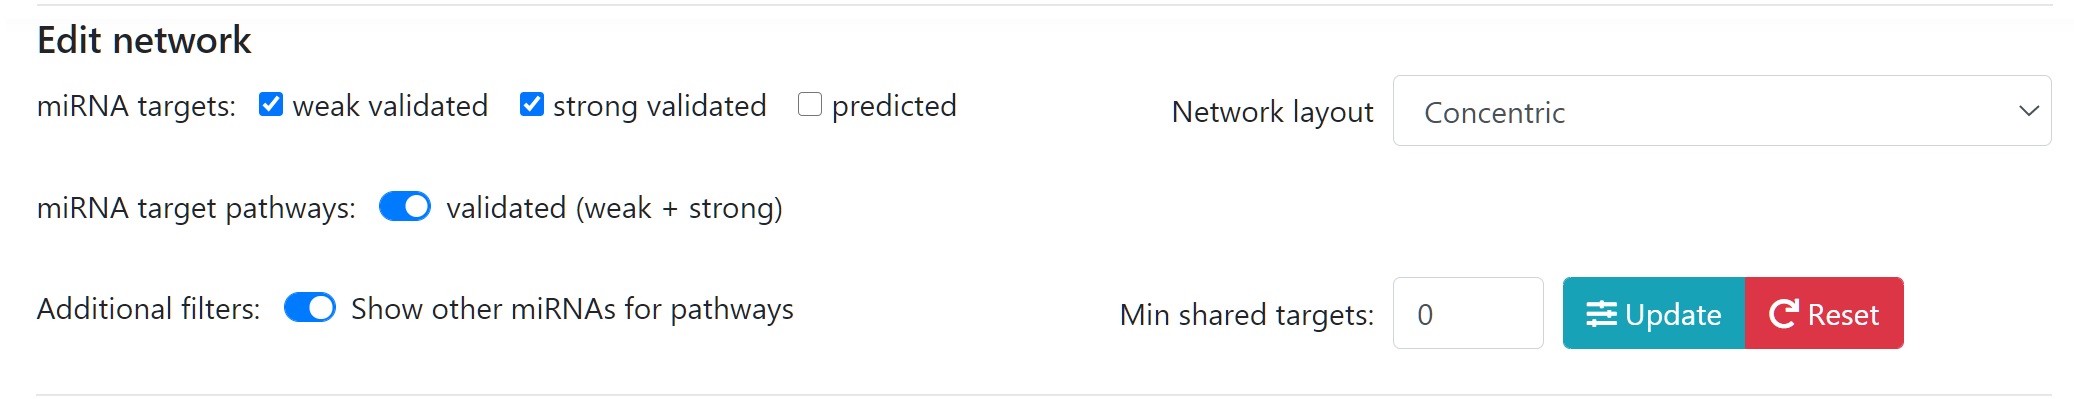
Several parameters are provided to include/exclude nodes in the network depending on the type of evidence available (weak, strong or predicted), if pathways should be included or not and filter a minimum of shared targets.
Several graph layouts are also available to alter the aspect of the network.
Interaction table
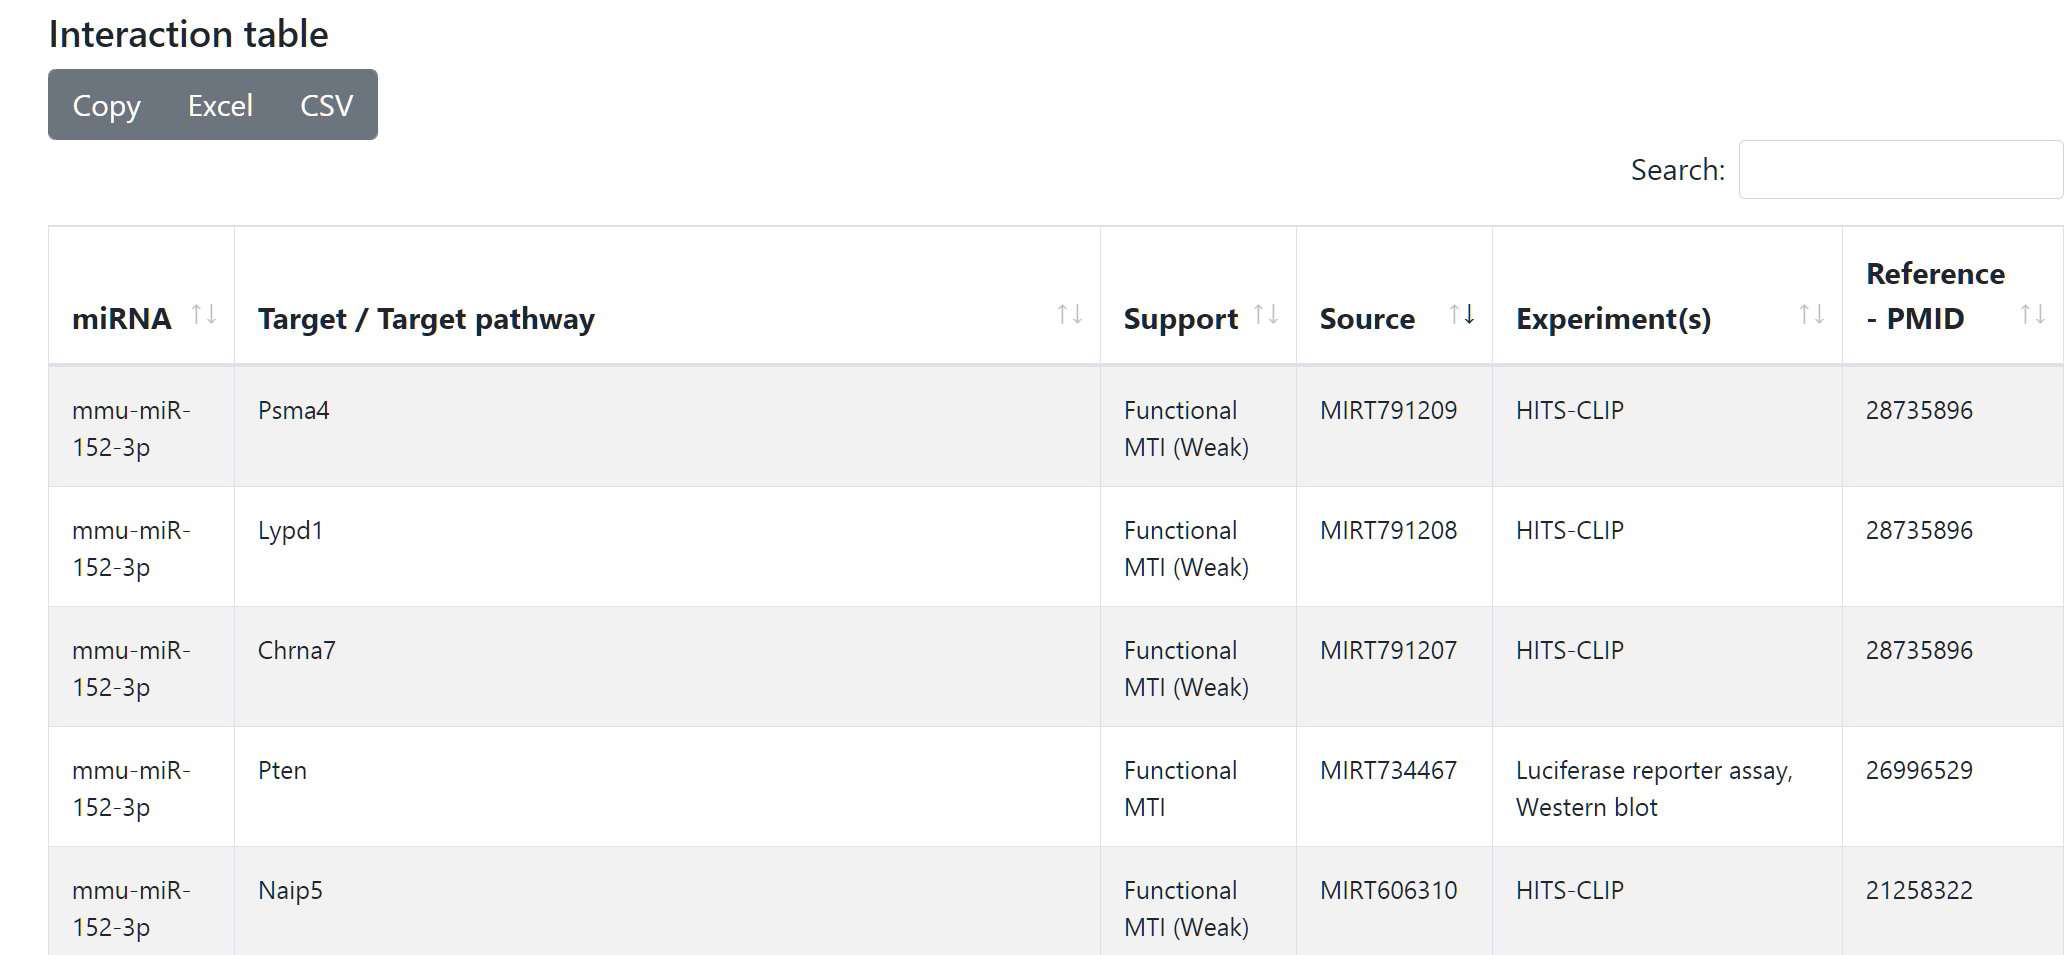
At the bottom of the page two tables are displayed. The first table contains all nodes and interactions included in the network. Users can search specific elements and see how much support an interaction has and its source database. Additionally, experimental support and references are also shown if available. The data can be exported in different tabular formats (Excel, CSV) or copied to clipboard.
Node annotation table
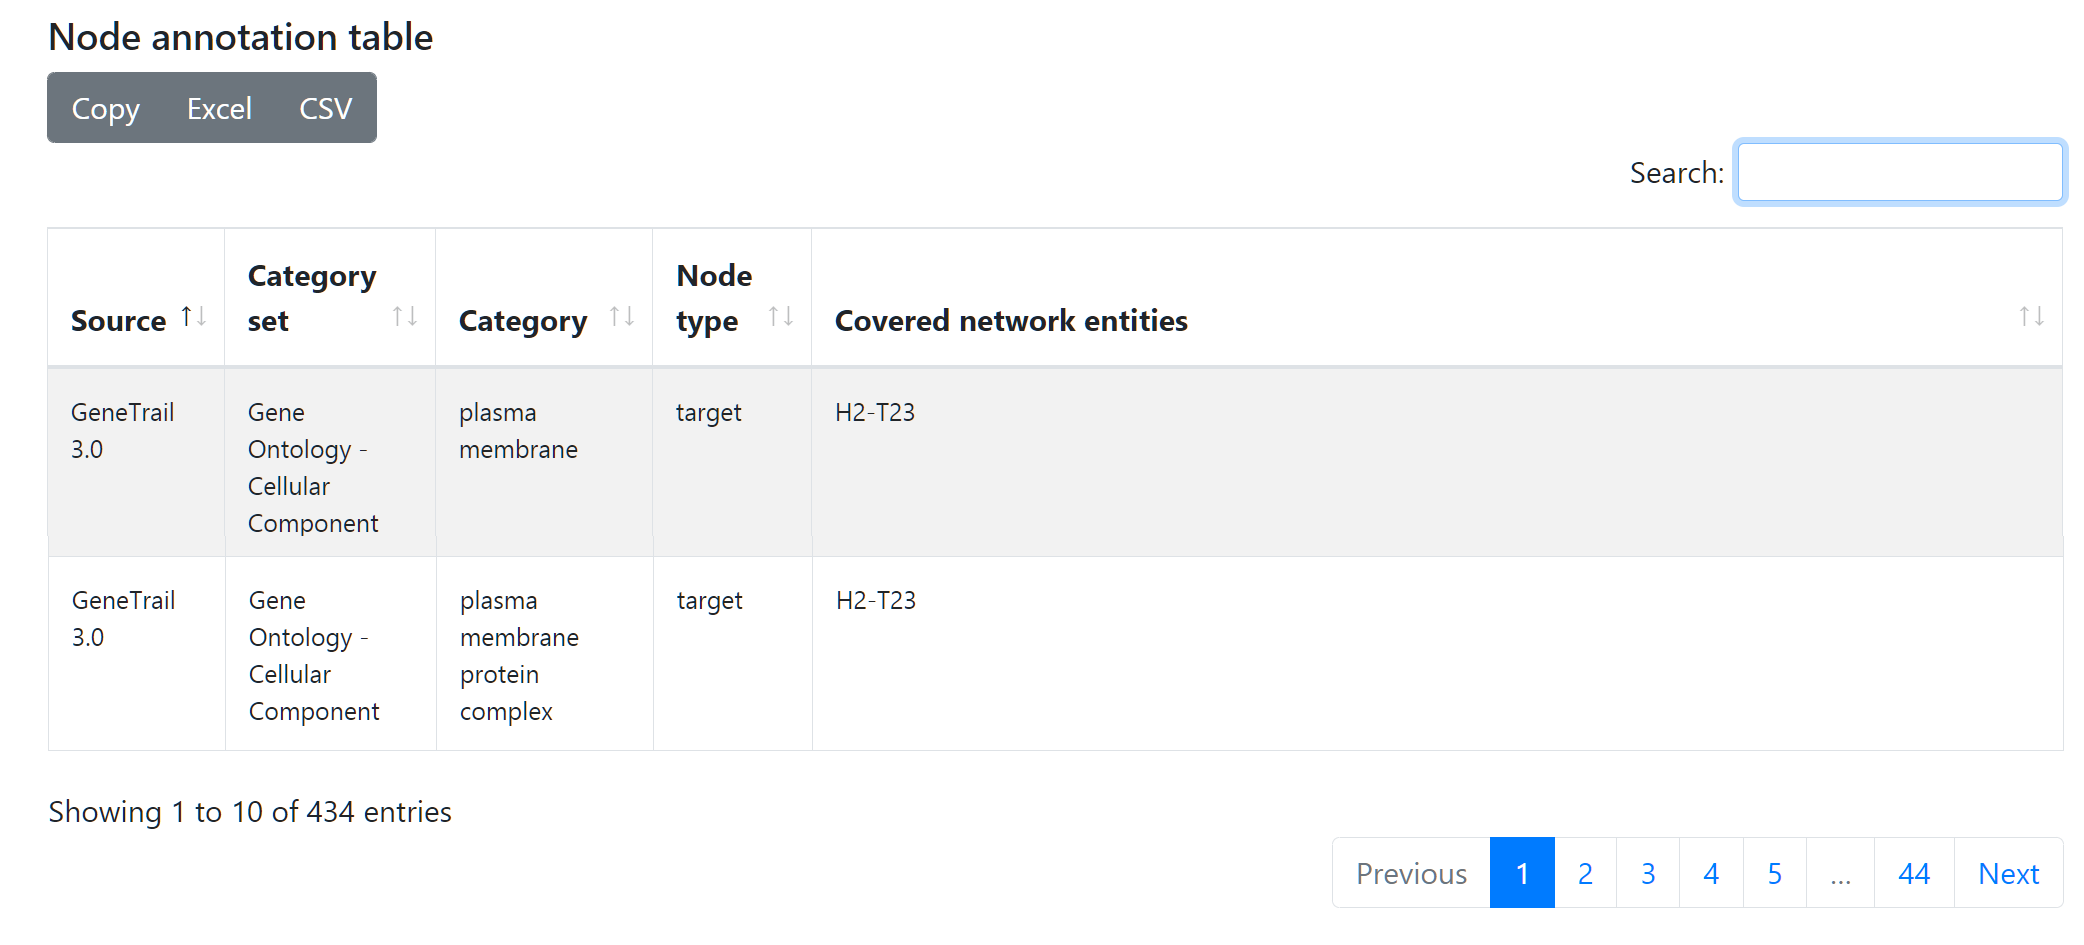
The second table displays different annotations available for each node, depending on them belonging to a microRNA set from miEAA or a gene set from GeneTrail. This table can be used, among other things, to explore the role of confounding factors such as gender or age as there are corresponding miEAA sets for them. The data can be exported in different tabular formats (Excel, CSV) or copied to clipboard.
Additional node info
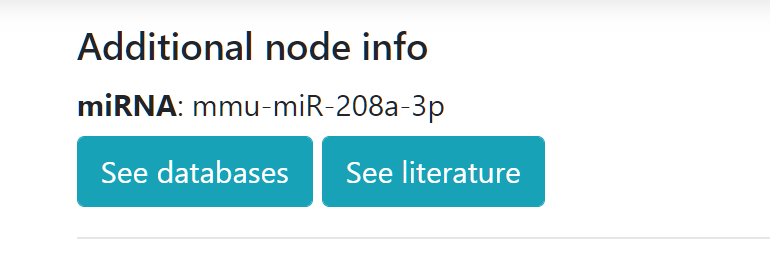
Last node clicked will appear in this section together with two buttons. The "See databases" button will display further links to different resources according to the species and type of node selected. If you click on "See literature" a pop-up will be shown allowing to query PubMed using the name of the node clicked and a series of terms including sex, age, localization, etc.
Edit selected nodes
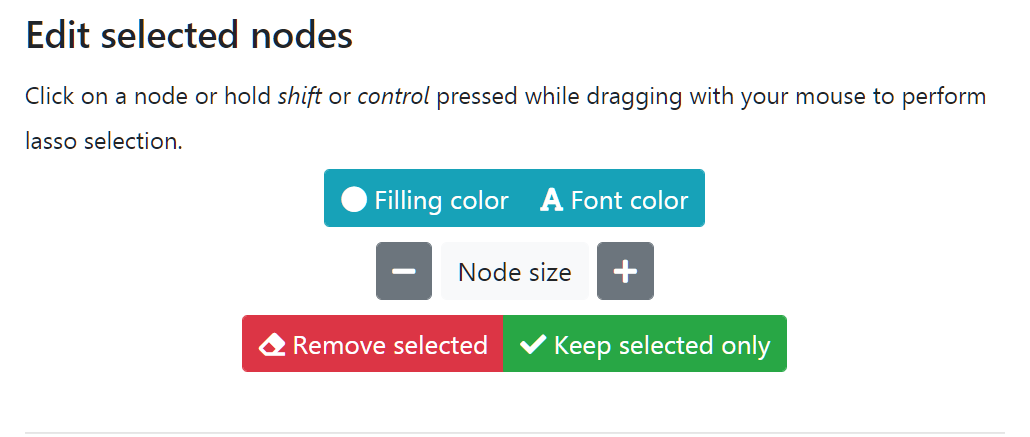
Nodes can be clicked one by one to select each of them or holding down Ctrl for multiple selection. Lasso selection is activated by holding down the Shift key. Once nodes are selected they will be highlighted together with edges connected to them.
You can use buttons in this panel to change color and size of the selected nodes. It is possible to remove a selection of nodes or the graph can be reduced only to those currently selected. Please note that by changing the criteria and updating the network using the Edit network parameters these changes will be lost.
Export section
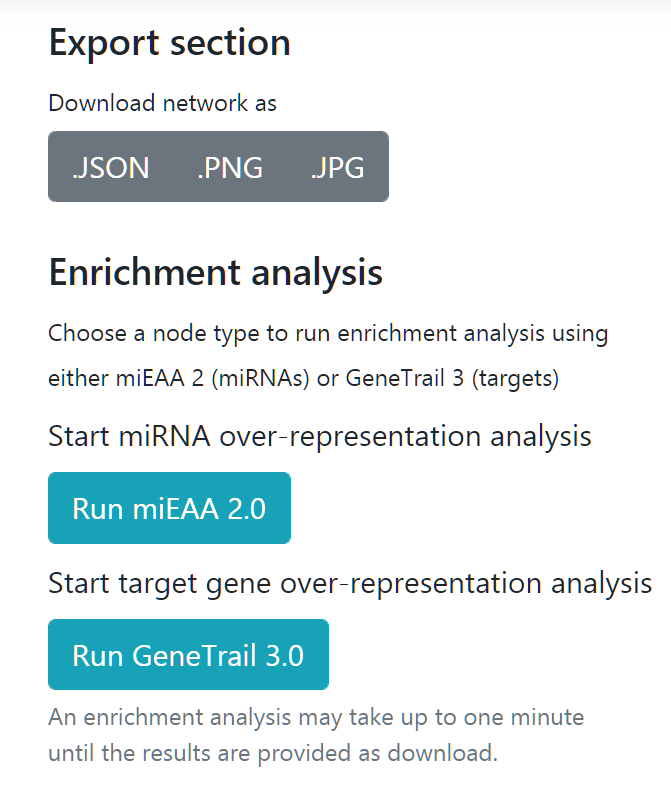
In this section users can save their visualization as image files (.PNG or .JPG) or choose to export their network as json so further downstream analysis can be carried out using external network analysis software.
miRTargetLink is integrated with other tools from the Chair for Clinical Bioinformatics. Users can easily run miRNA enrichment analysis or gene enrichment analysis with miEAA or GeneTrail, respectively.
Users can also systematically test the enrichment in their network using these two APIs for miRNAs and target genes. For instance, this can be useful to test the presence of sex or gender bias in the spawned network.