miRMaster Tutorial
Getting started
Introduction
With miRMaster you can analyse your NGS sncRNA samples. To get started you only need two things:
- Sequencing files in FASTQ format (uncompressed or .gz compressed).
- The name of the library preparation kit or the library construct layout.
Once you have these information click on the Launch experiment button on the homepage or in the navigation bar. There you will be guided through 3 steps, where you can name your experiment, provide the used experimental protocol and finally upload your sequencing files.
If you have additional metadata information for your samples, such as a diagnosis for which you would like to perform differential expression analysis you can provide this information by clicking on the buttons below the upload area. This will allow you to name your annotations and to upload an annotation file. Once you have chosen your files and added your metadata you can click the launch button to start processing your data and sending it to the server. You can follow the progress in real-time by clicking the follow button.
This will open the experiment status page in a new tab, where you will be able to track the progress of the analysis of all your uploaded samples. Real-time web reports are provided for each sample that has been uploaded, allowing you to directly inspect your data. They provide information on the preprocessing, mapping, quantification and miRNA candidate prediction steps.
As soon as all samples have been analyzed, the results can be downloaded and an overall web-report is created and will be displayed on the top of the page.
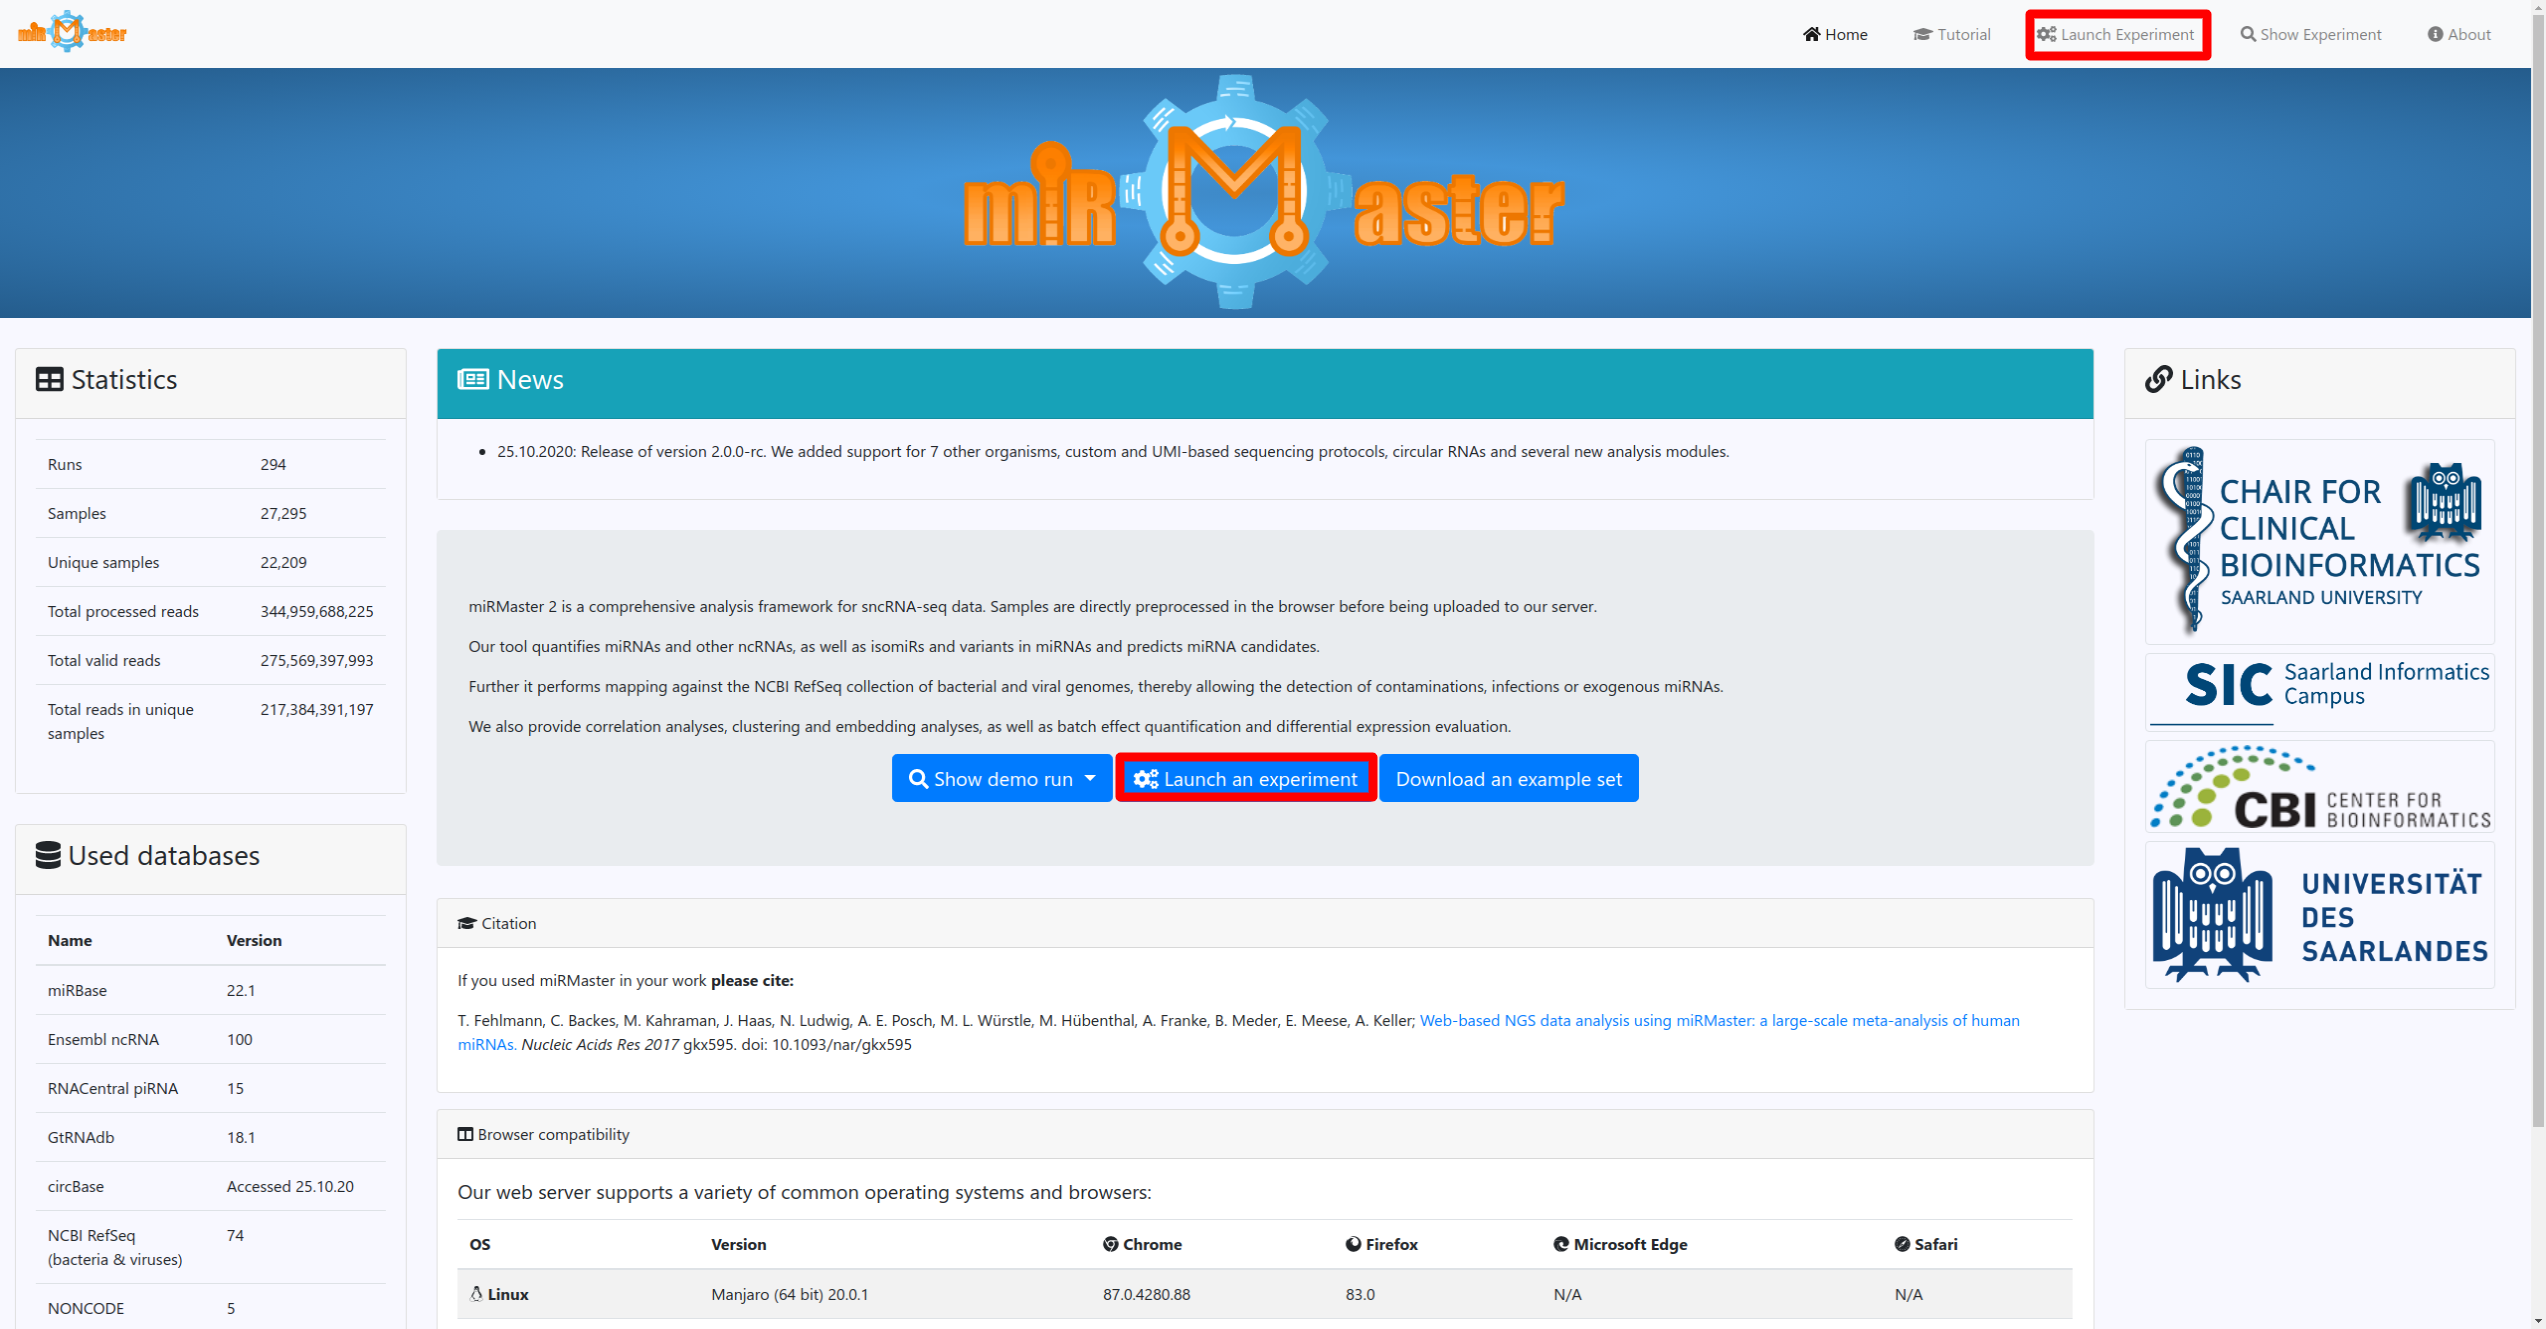
Start an experiment
Start an experiment by clicking on one of the highlighted buttons.

Experiment Name
Provide an experiment name for your analysis.

3' Adapter
Provide or choose the 3' adapter of your sequencing run.
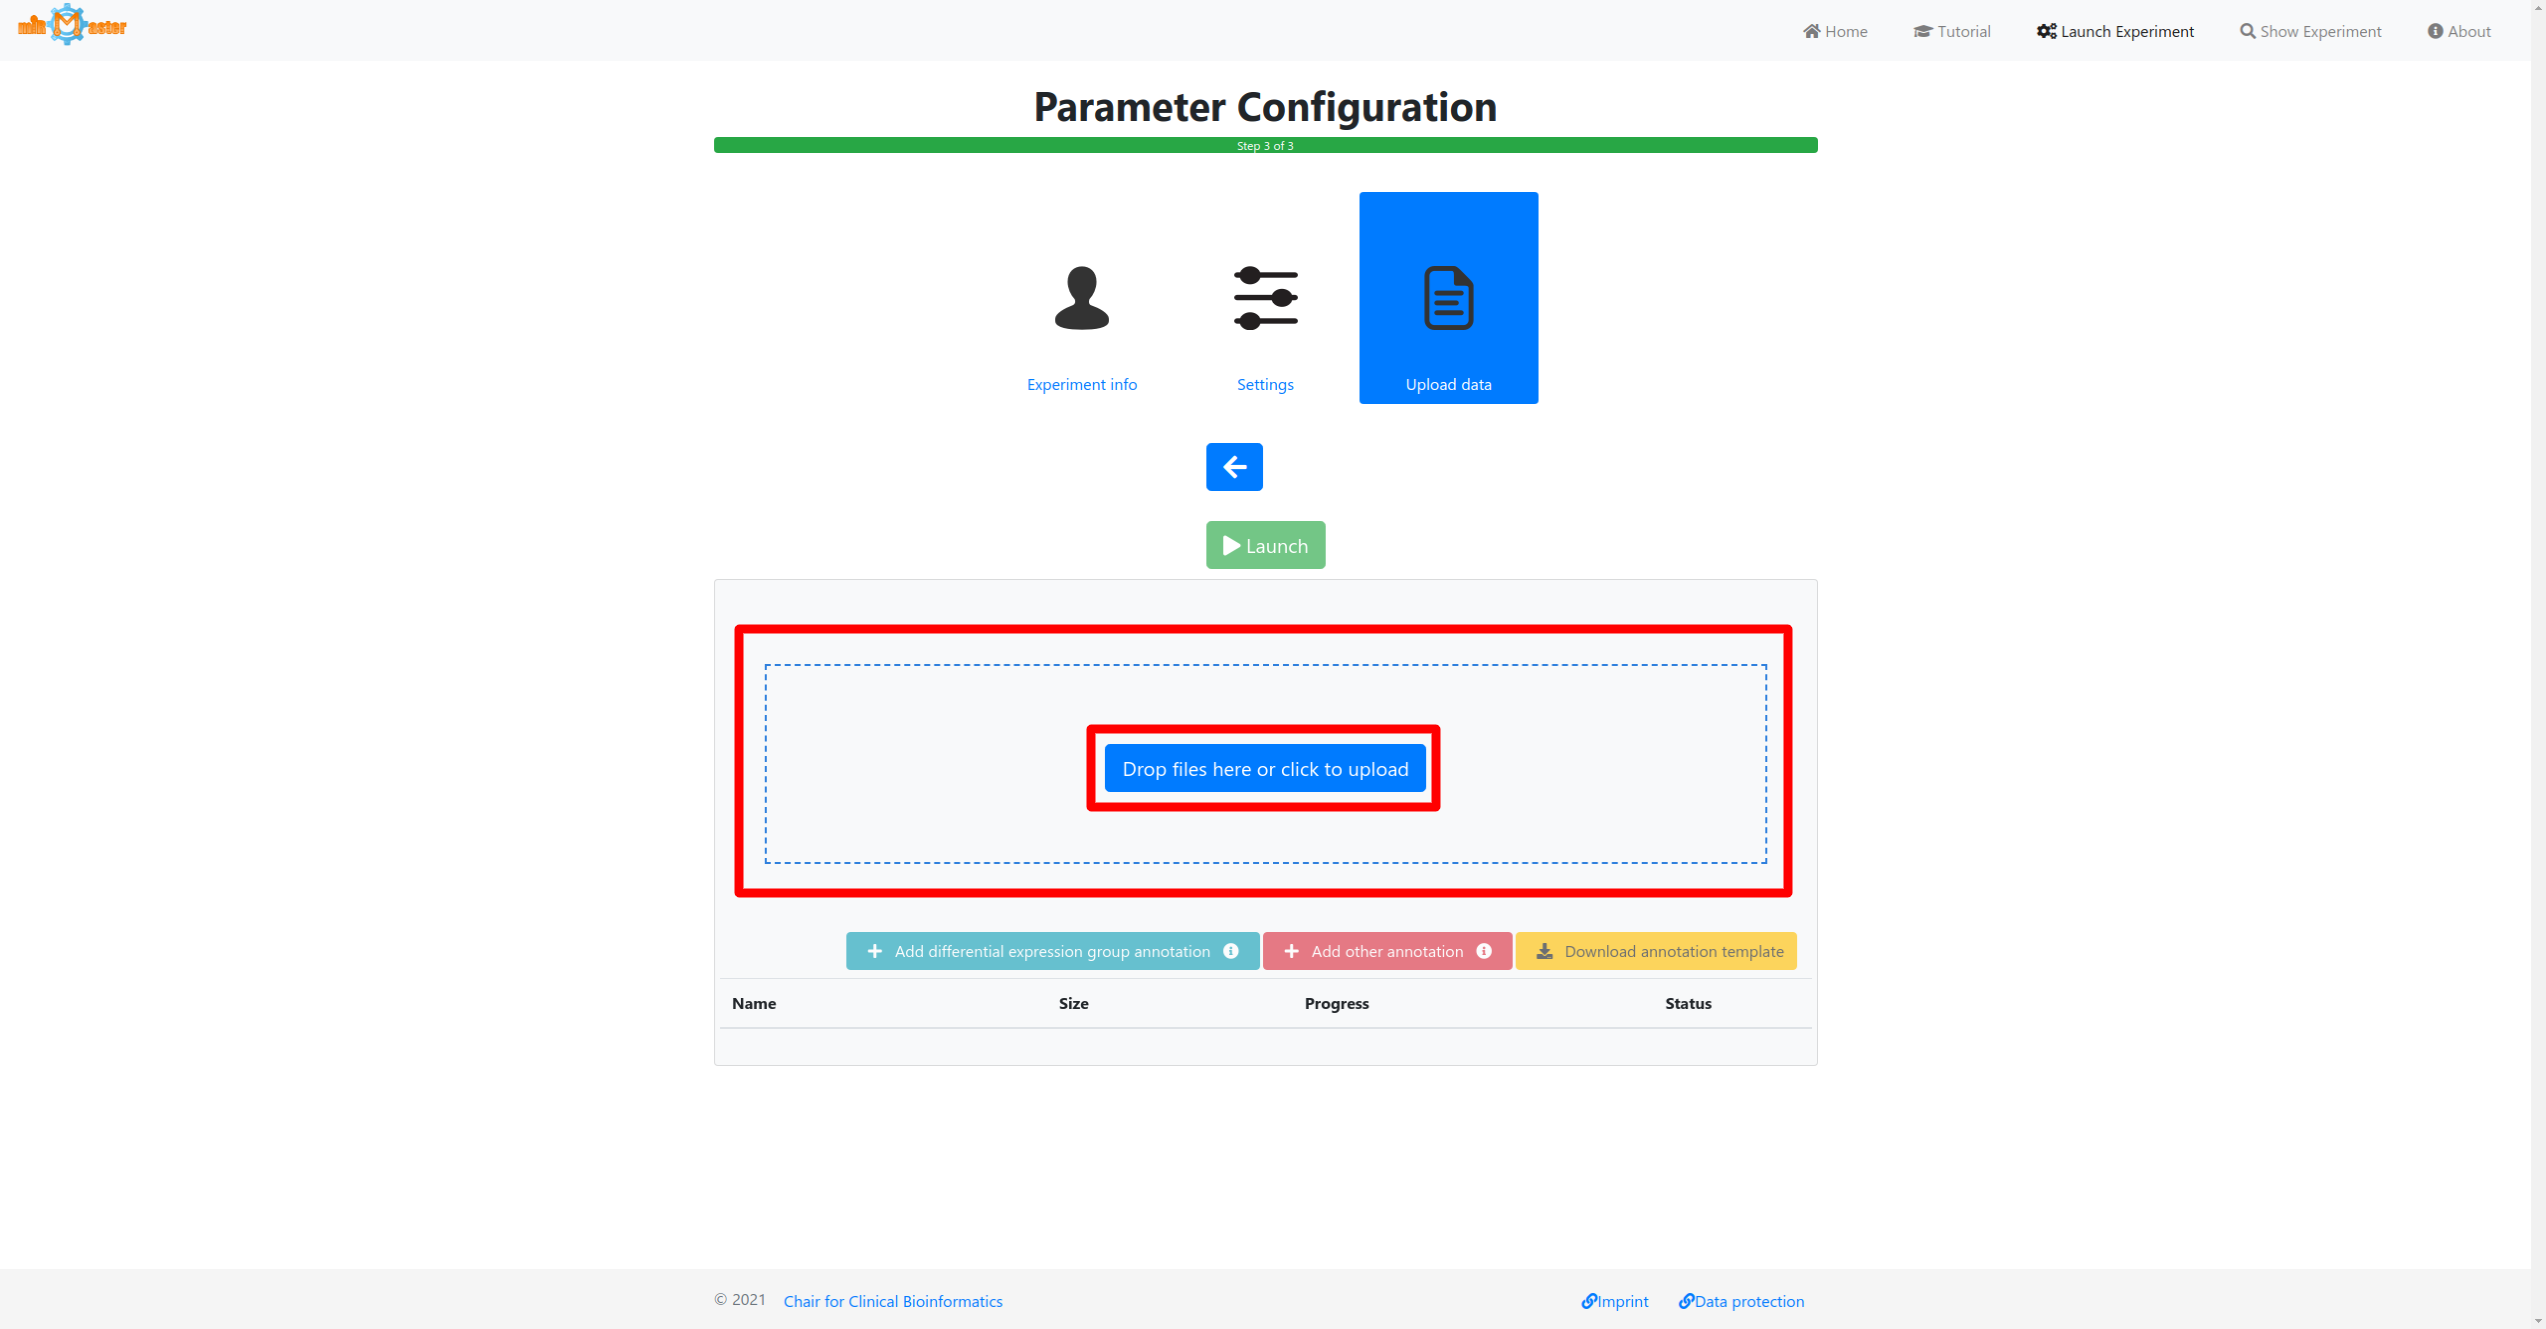
Sample Upload
Drag and drop your files in the box or click to select your FASTQ files.

Add additional metadata
Optionally, specify a group annotation for which to perform differential analysis or additional other annotations (sequencing batch, sex, smoking status, ...)

Add annotation label name
Specify the label of your annotation.

Upload annotation
Select and upload the corresponding annotation mapping file.
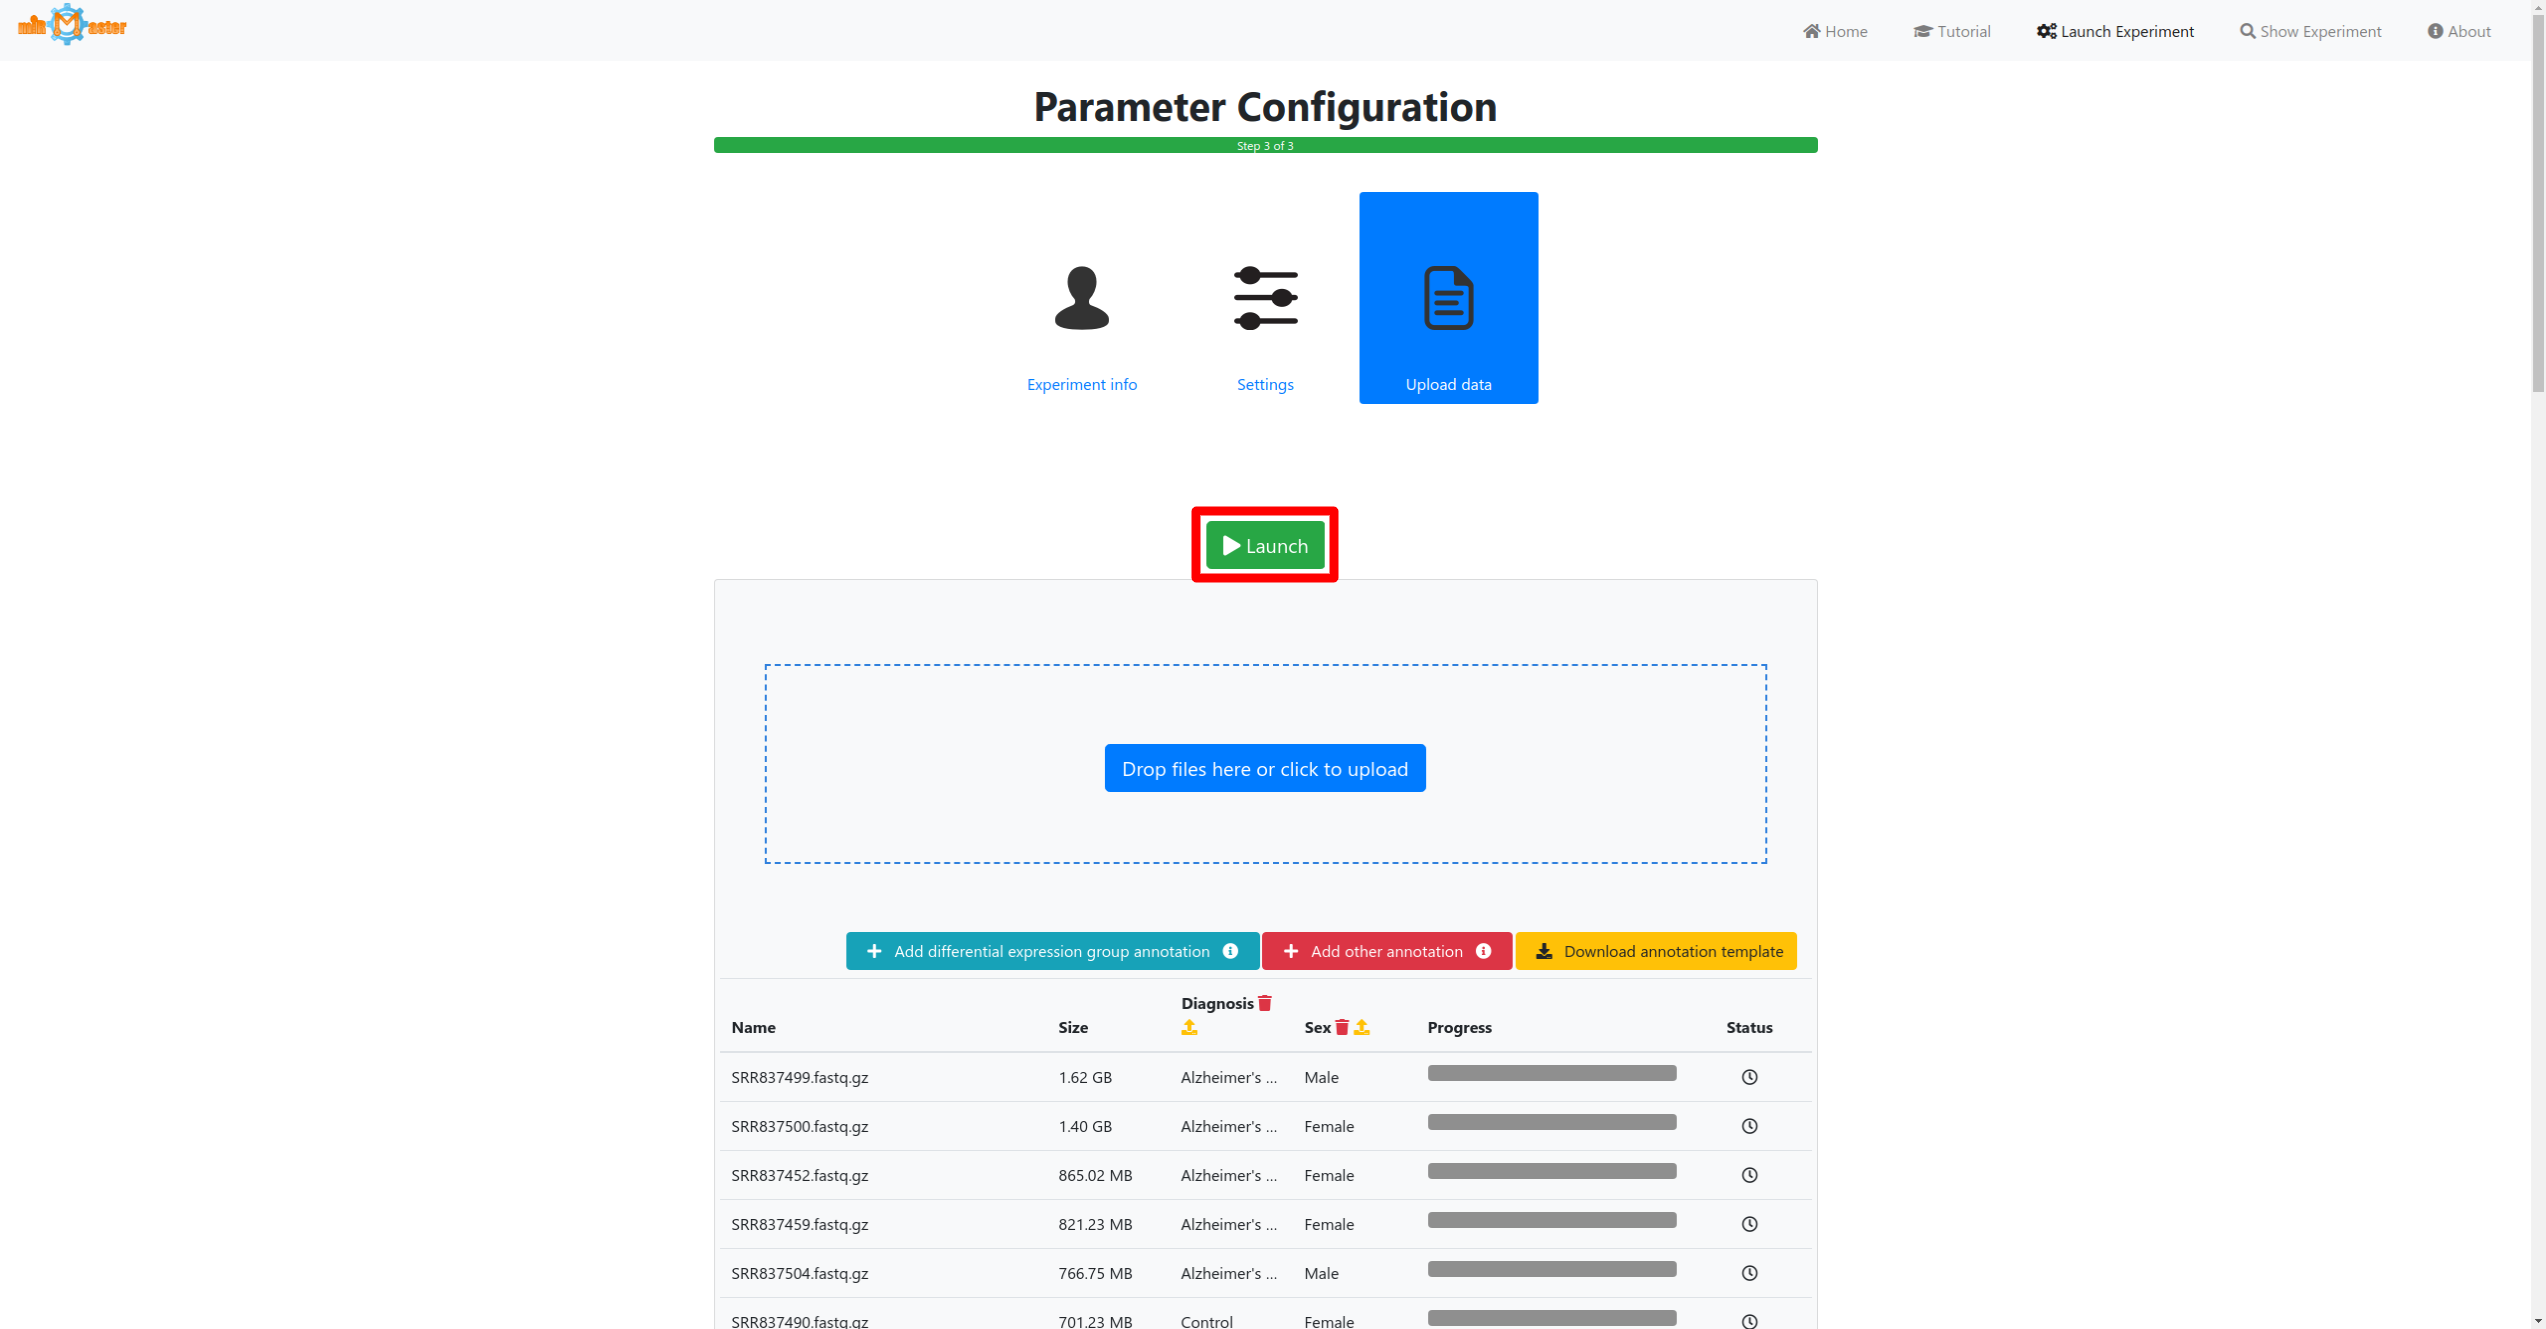
Launch
Start the analysis by clicking on the launch button.
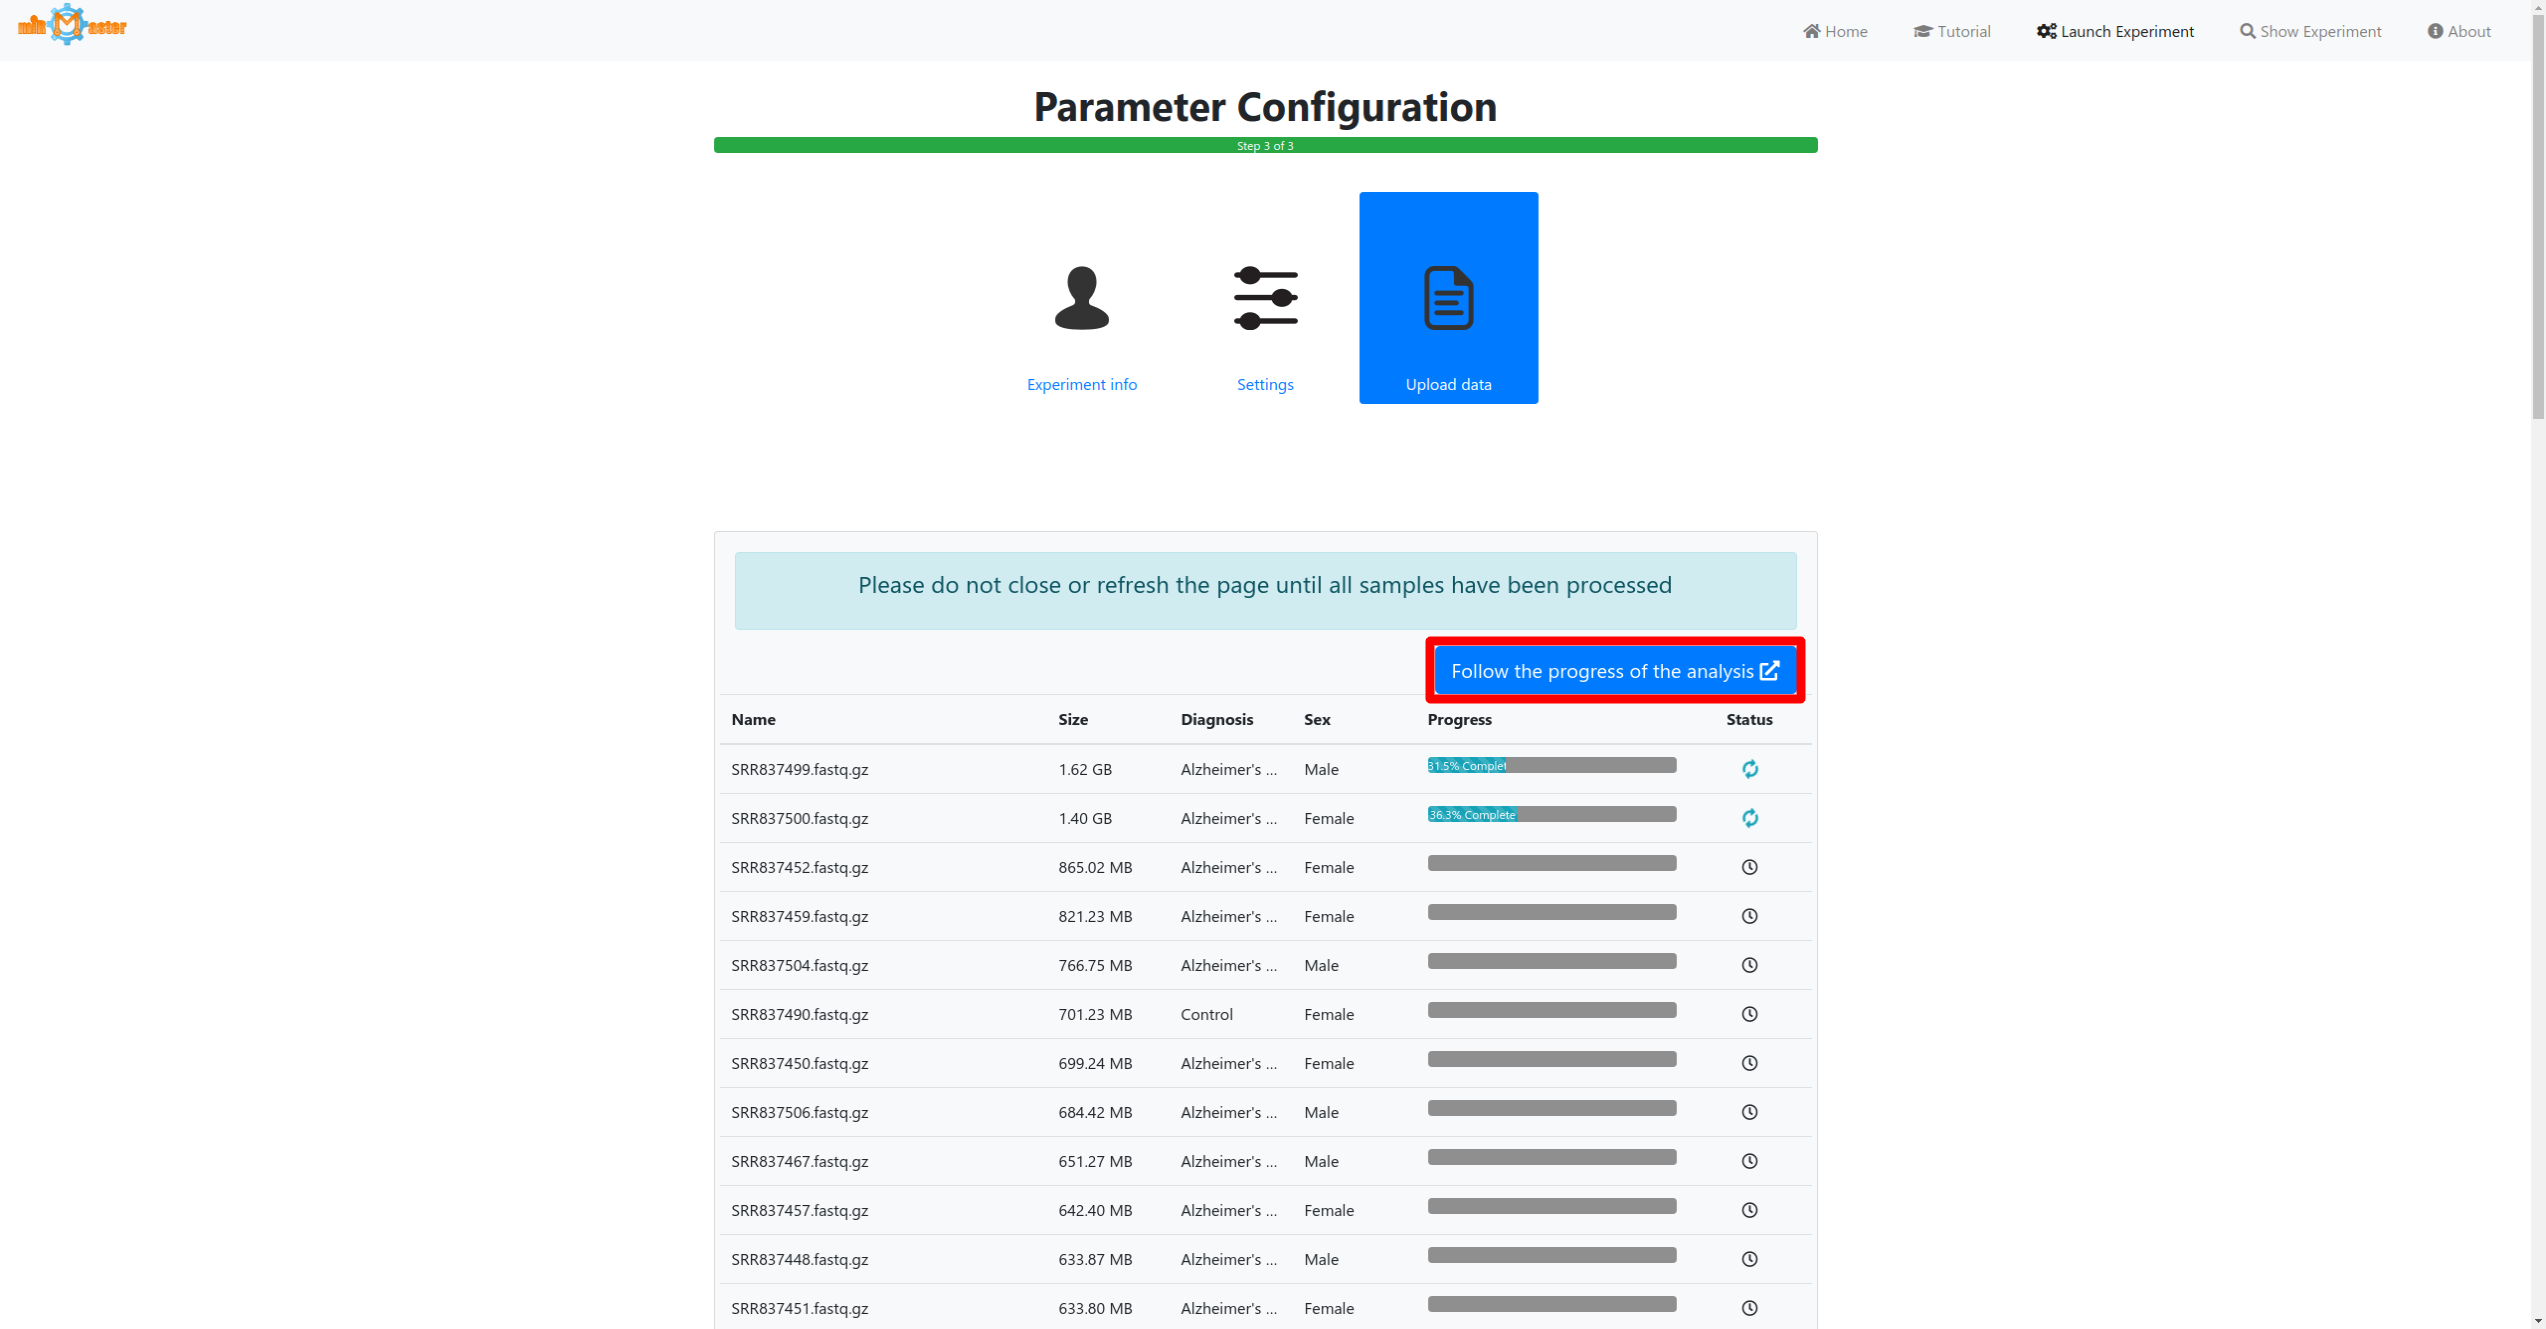
Real-time Progress
Follow the progress of the analysis of your samples in real-time by clicking on the highlighted button.

Real-time Reports
Reports for each sample can be opened while the samples are processed and display the so far available data.
Overall Report
An overall report and a download link to all resulting tables is generated once all samples have been processed.
Demo run and example samples
We provide two ways for trying out miRMaster:
- You can directly inspect a pre-generated demo run of 70 samples (48 Alzheimer's Disease, 22 controls) from GEO (GSE46579).
- You can download an example set of 4 samples (2 Alzheimer's Disease, 2 controls), configure your own run and follow the result generation in real-time.
Want to know more?
For a more detailed explanation of the options provided for the analysis setup please read the Starting an analysis section. If you would like more information on the report pages please read the Inspecting results section.
Starting an analysis
The analysis configuration is divided into the following three steps.
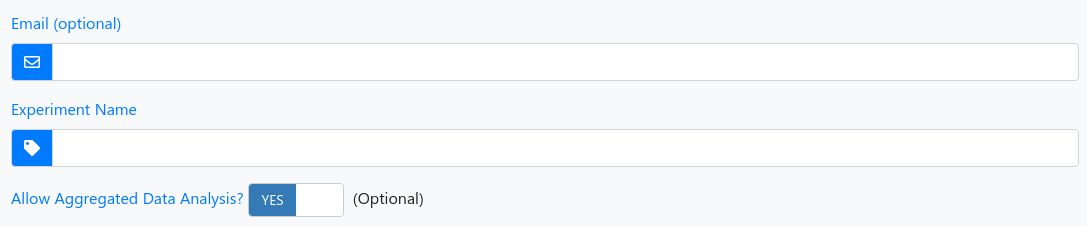
1 - Experiment information
| Email (optional) | We will notify you as soon as the analysis of your uploaded samples is done. |
| Experiment Name (required) | Assign a name to your experiment run so that you will be able to recognize it later. |
| Aggregated Data Analysis | You acknowledge and agree that your data are included in an aggregated analysis. Please note: no experimental information or other data than summarized reads are considered. With the aggregated data analysis you will learn about the specificity of findings in your experiment and at the same time you further the development of miRMaster and miRCarta. |
2 - Settings
The settings are divided in the following five categories. All options except the 3' adapter have reasonable default settings. The options for each category can be shown by clicking on the category bars. Even more options can be shown by toggling the expert mode switch.
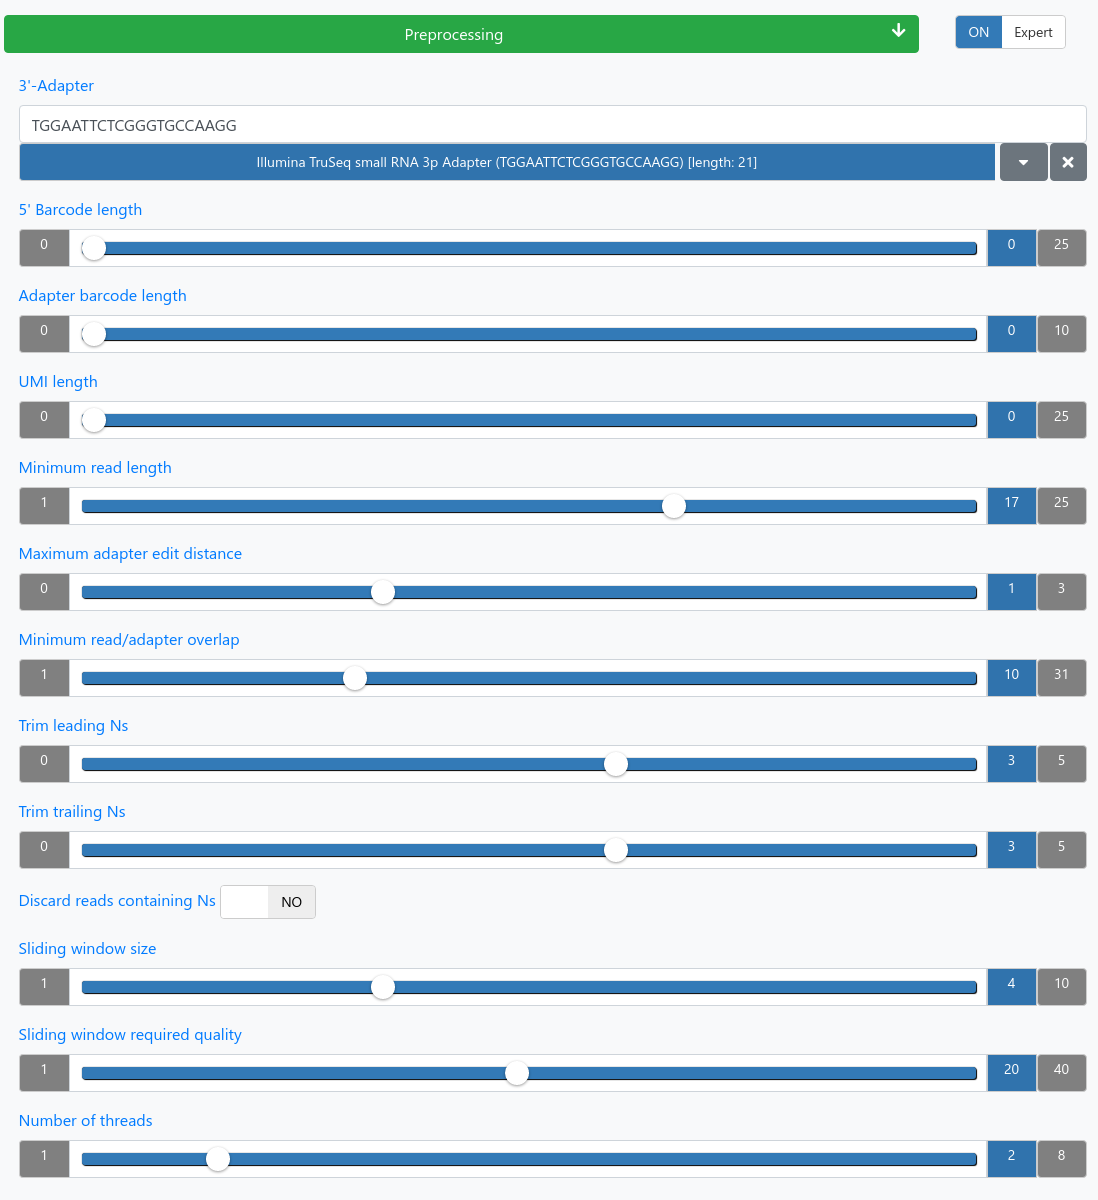
Preprocessing
| 3'-Adapter (required) | Provide or choose the 3' adapter of your sequencing run. |
| 5' Barcode length | Length of the barcode that should be removed at the beginning of each read. |
| Adapter barcode length | Length of the adapter barcode which precedes the actual adapter that should be removed. |
| UMI length | Length of the UMI. A value of 0 implies that no UMI was used. We assume that the read first starts with the UMI. |
| Minimum read length | Only trimmed reads with the specified length will be kept. |
| Maximum adapter edit distance | Maximum edit distance of the adapter to the reads. |
| Minimum read/adapter overlap | How many nucleotides must overlap between the found adapter and read, in case the adapter is not fully contained in the read. |
| Trim leading Ns | The first X leading bases are discarded if they contain Ns. |
| Trim trailing Ns | The last X trailing bases are discarded if they contains Ns. |
| Discard reads containing Ns | If reads still contain Ns after the trimming they will be discarded. |
| Sliding window size | The size of the sliding window to look at when averaging base qualities. |
| Sliding window required quality | The minimum average window quality needed to keep the sequence. If the quality falls below the minimum the sequence is trimmed from that position on. |
| Number of threads | The number of threads to use for preprocessing your samples in the browser. |
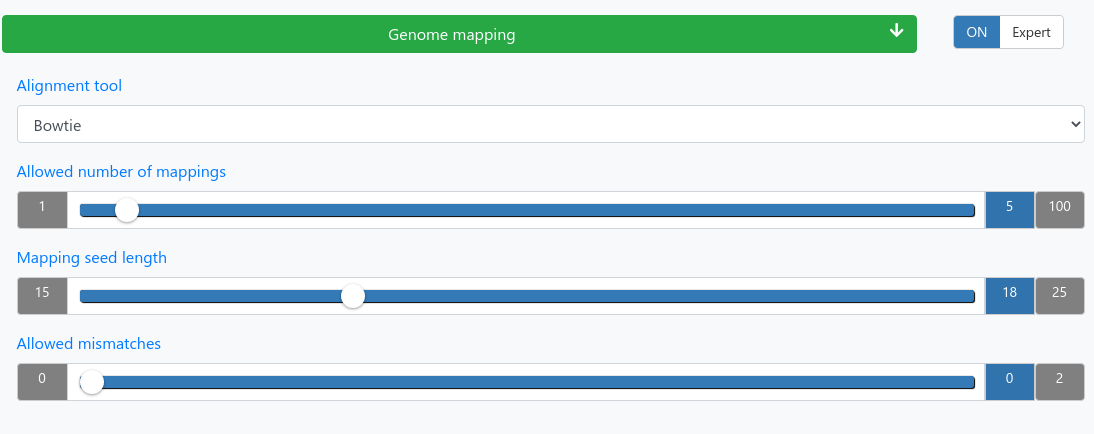
Mapping
| Alignment tool | Bowtie or STAR |
| Allowed number of mappings | Reads mapping to more than the allowed number of locations will be discarded. |
| Mapping seed length | Only mismatches in the seed region count. |
| Allowed mismatches | Maximum number of allowed mismatches in the seed region. |
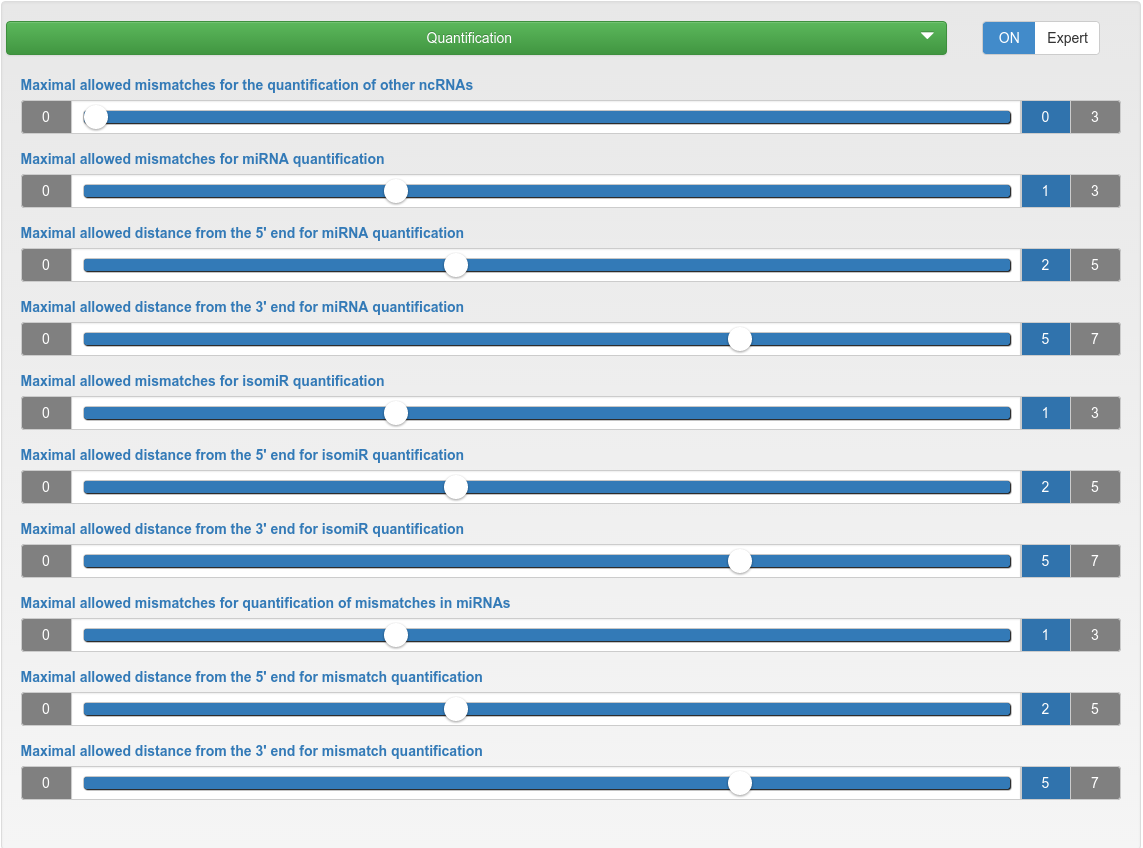
Quantification
| Maximal allowed mismatches for the quantification of other ncRNAs | The maximum number of mismatches allowed during the quantification of other ncRNAs. |
| Maximal allowed mismatches for miRNA quantification | The maximum number of mismatches allowed during the quantification of known and novel miRNAs. |
| Maximal allowed distance from the 5'/3' end for miRNA/isomiR/mismatch quantification | The maximum allowed distance of the read 5'/3' end to the 5'/3' end of the annotated miRNA position. |
| Maximal allowed mismatches for isomiR quantification | The maximum number of mismatches allowed inside a read (the flanks are excluded to account non-template nucleotide additions) during the isomiR quantification of known and novel miRNAs. |
| Maximal allowed mismatches for quantification of mismatches in miRNAs | The maximum number of mismatches allowed during the quantification of mismatches in known and novel miRNAs. |
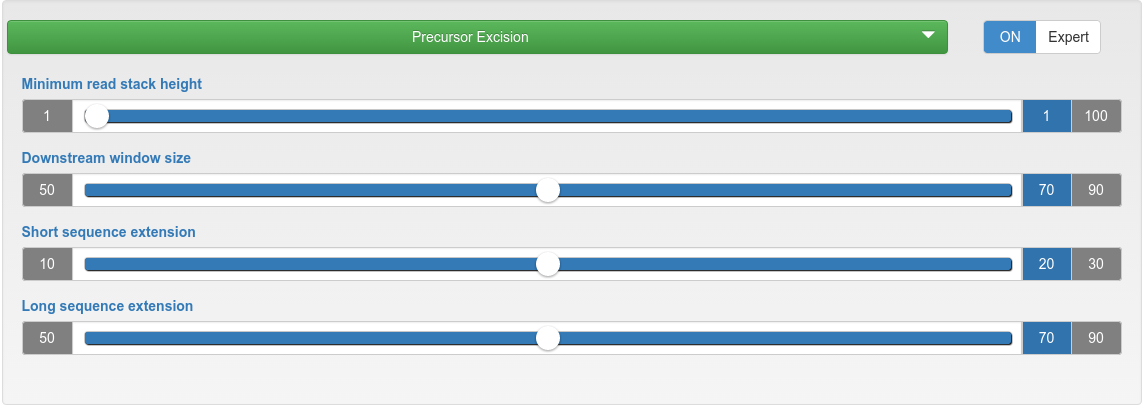
miRNA candidate predicition - precursor excision
| Minimum read stack height | The minimum count for reads from which precursors are excised. |
| Downstream window size | In downstream (5' to 3') direction, the highest read stack is searched in a window size of X nucleotides, from which two potential precursors are excised. |
| Short/long sequence extension | Related to the highest read mapping stack. On one side a short sequence extends the mapping region, while on the other side a long sequence extends it. As result for that region, two potential precursors are excised: short-mapped-long and long-mapped-short. |
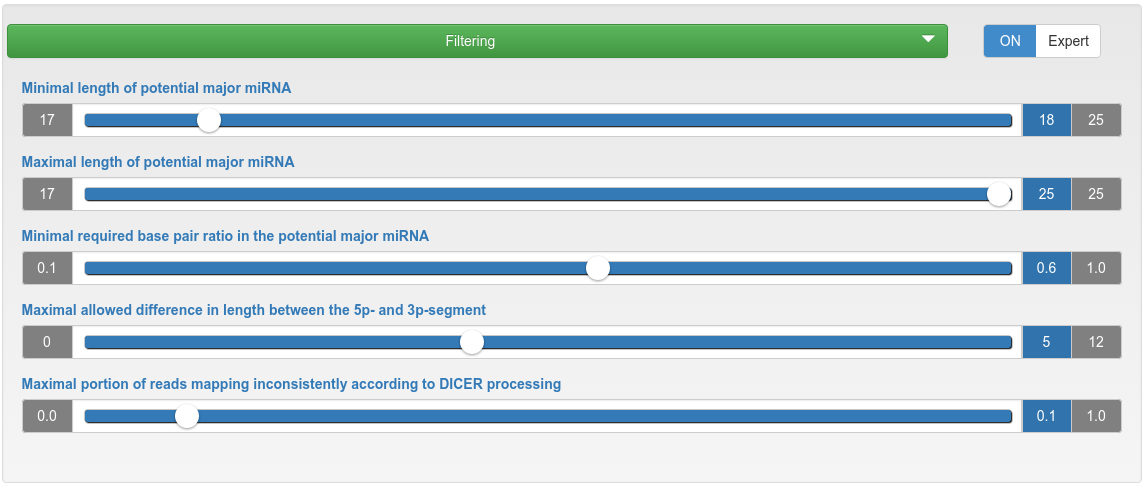
miRNA candidate prediction - filtering
| Minimal/Maximal length of potential major miRNA | If the length of a potential mature miRNA is lower/higher than this threshold, then the corresponding precursor will be discarded. |
| Minimal required base pair ratio in the potential major miRNA | If a potential mature miRNA has a base pair ratio lower than this threshold, the corresponding precursor will be discarded. |
| Maximal allowed difference in length between the 5p- and 3p-segment | If the length difference between a 5p- and 3p-segment is higher than this threshold, then the corresponding precursor will be discarded. |
| Maximal portion of reads mapping inconsistently according to Dicer processing | If the portion of reads mapping inconsistently to a precursor according to Dicer processing is higher than the specified maximum, that precursor will be discarded. |
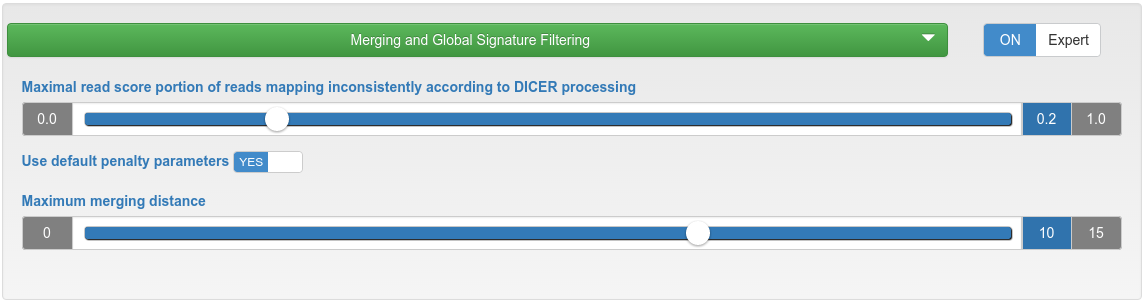
miRNA candidate prediction - merging and global signature filtering
| Maximal read score portion of reads mapping inconsistently according to Dicer processing | If the read score portion of reads mapping inconsistently to a precursor according to Dicer processing is higher than the specified maximum, that precursor will be discarded. |
| Use default penalty parameters | Reads mapping with mismatches are penalized per default by a dividing factor if they occur in at most 10% of all samples (but at most 10 samples). The dividing factor is the limit of occurring samples minus 1, but at least 2. This means that penalties are only introduced when uploading 10 or more samples. |
| Mismatch score penalty (modifiable when default penalty = NO) |
When scoring the global signature we penalize reads mapping with mismatches to the precursor by a dividing factor. |
| Maximum occurring number of samples for score
penalty
(modifiable when default penalty = NO) |
If a read mapping with a mismatch occurs in more than the specified number of samples its score is not penalized. |
| Maximum merging distance | Precursors are merged if the distances of their start and end positions are within the specified maximum distance. |
3 - Data upload
In the last step first select the samples that should be analyzed either via drag-and-drop or by cliking in the upload box. If you have additional metadata information for your samples, such as a diagnosis for which you would like to perform differential expression analysis this information can then be provided by clicking the corresponding buttons below the upload area.
Click the launch button once all samples and metadata have been provided to start the analysis. A button to follow the real-time progress of the analysis will then appear. The preprocessing and upload progress are shown in progress bars in a table. Once the bar reaches 100% and the file has been upload it will turn green. During the preprocessing adapter will be removed from the reads, low quality reads will be filtered out or trimmed and reads with identical sequences will be collapsed, retaining only the number of identical reads and their sequence.
Inspecting results
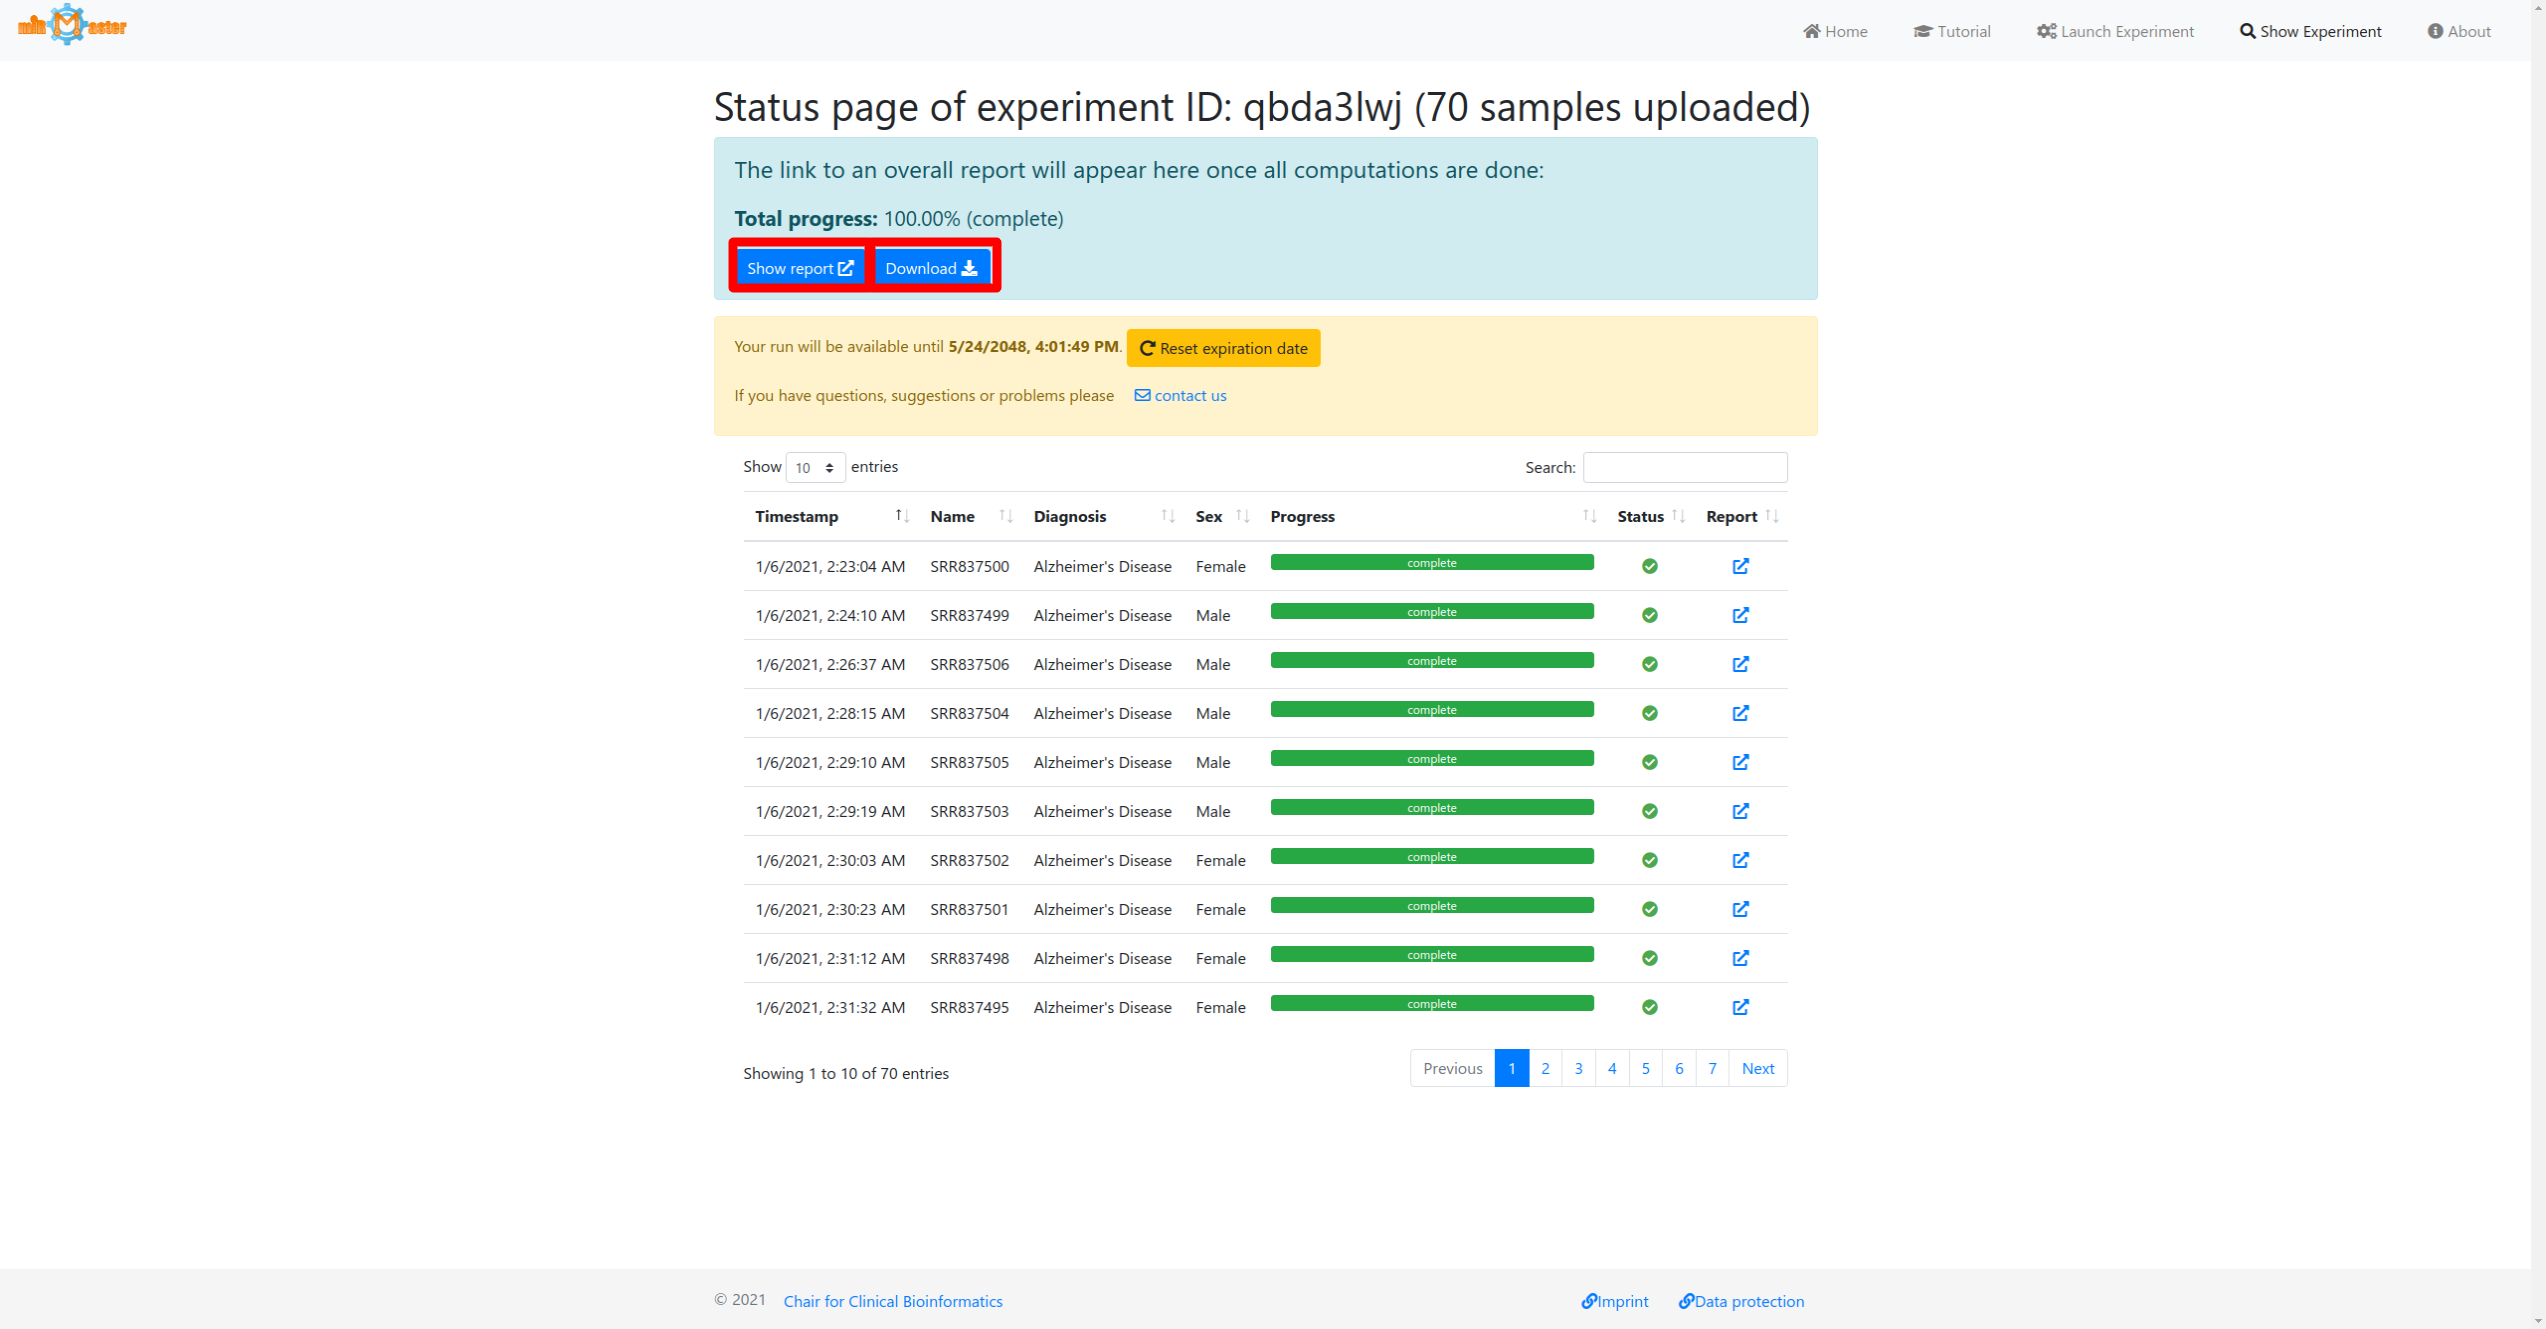
Status page (example)
The status page displays the real-time progress of your analysis. You can see how many samples have been transferred to the server and their current analysis progress. Each row in the status table shows the timestamp when the sample reached the server, the sample name, its current analysis progress, the status and a link to its real-time report. If provided, additional metadata is displayed in the table as well.
In case an analysis fails the bar will turn red and a failure icon will be shown in the status column. Samples that have not been processed yet will have grey bars and a pending status icon.
Once all individual samples have been processed an overall report will be generated. When the total progress reaches 100%, the results will be available for download at the top of the page, as well as a link to the web-report.
Single sample report (example)
The report is divided into the following six categories. All plots and tables can be downloaded in multiple formats (png, svg, pdf, csv, xlsx).
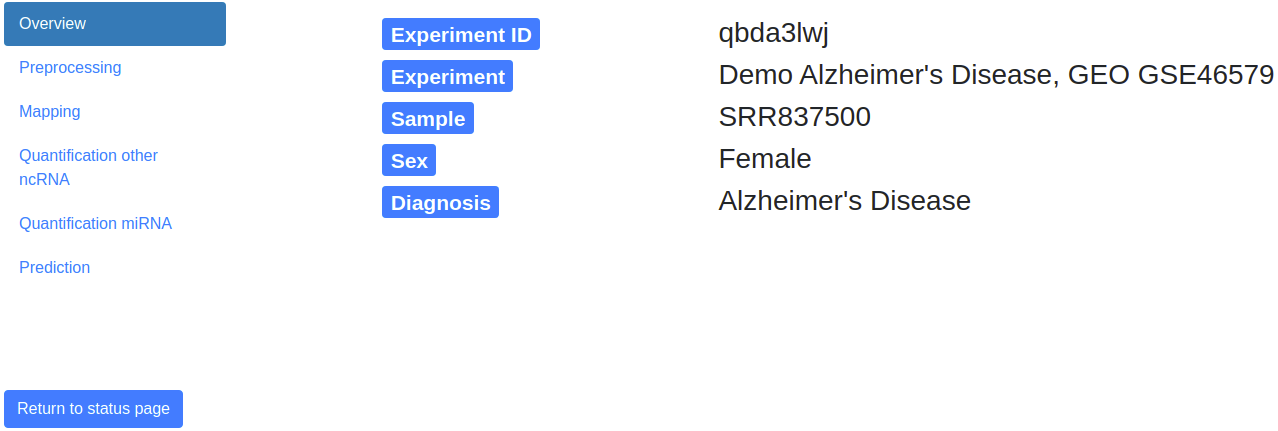
1 - Overview
The overview page provides information about the experiment id, name, the sample name and optionally provided annotations.
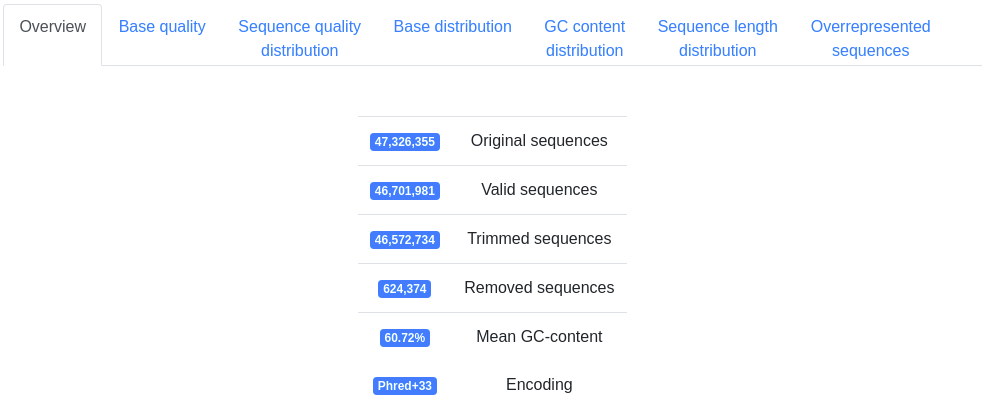
2 - Preprocessing
The preprocessing page provides information about the sequences found in the sample and is subdivided into seven tabs.
Basic information on the number of sequences processed, the mean GC-content and the detected FASTQ quality encoding.
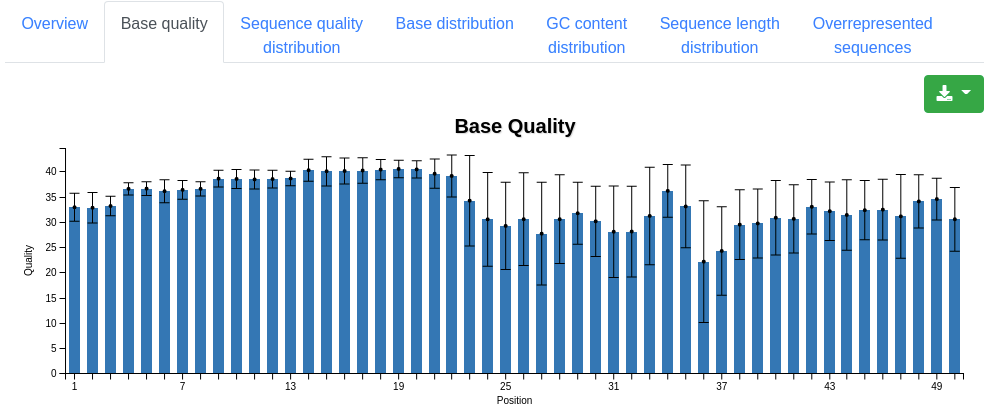
A plot displaying the mean quality and standard deviation of all valid sequences at each position.
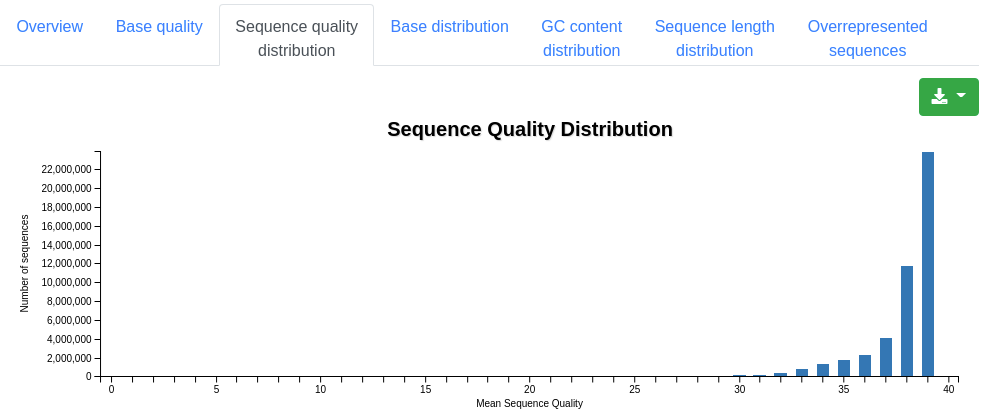
A plot displaying the number of sequences having a specific mean quality. Most sequences should have a mean quality near 40.
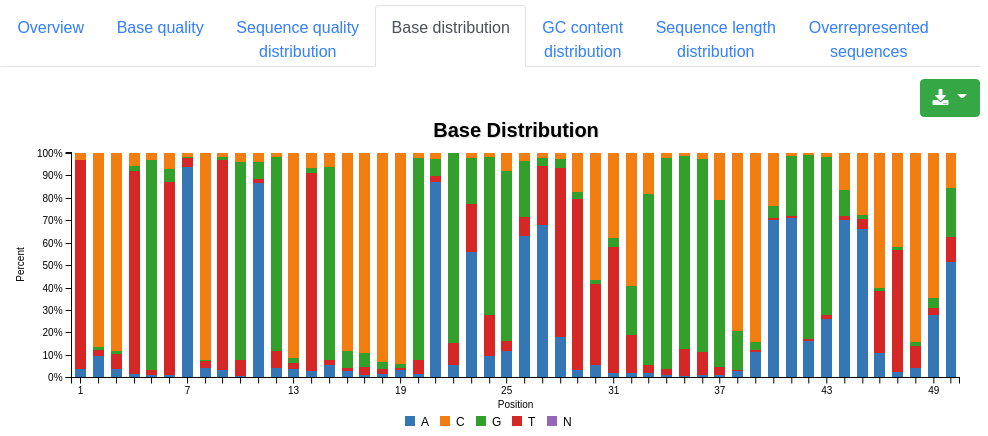
A plot displaying the base distribution at each position found in all valid sequences. Unknown bases that could not be recognized by the sequencer are described by N.
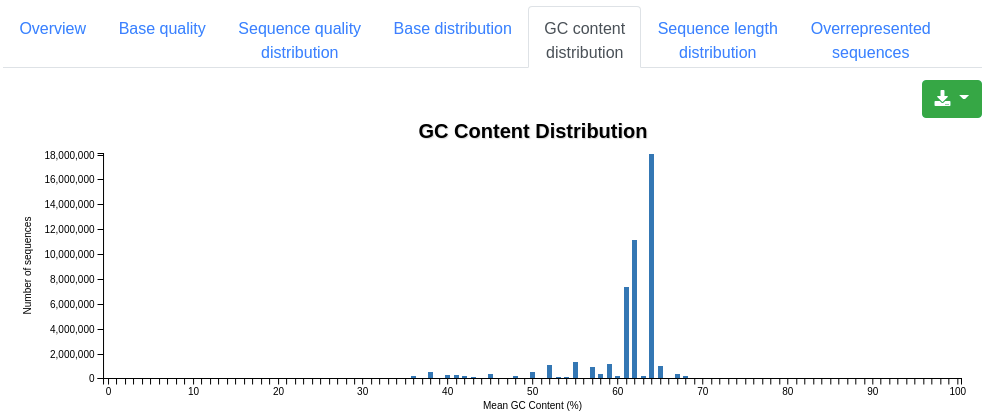
A plot showing the distribution of the mean GC content in percent among the valid sequences.
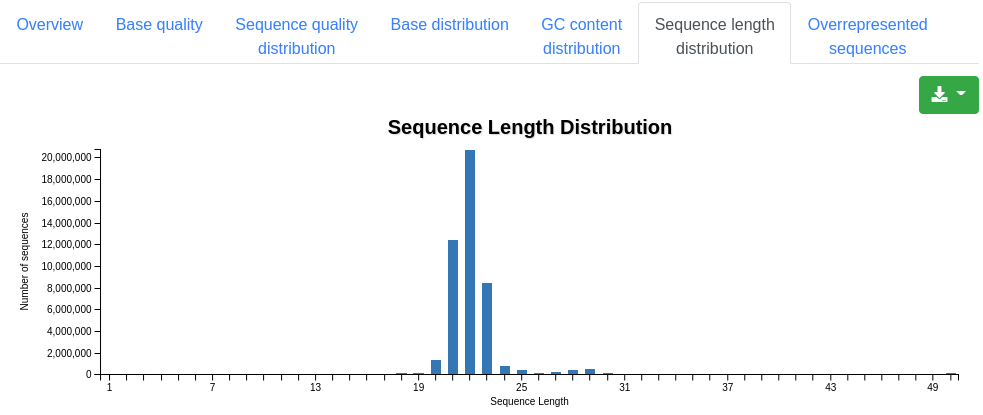
A plot showing the distribution of the sequence length among the sequences. For miRNA sequencing data peaks should be observed around 22 nucleotides.
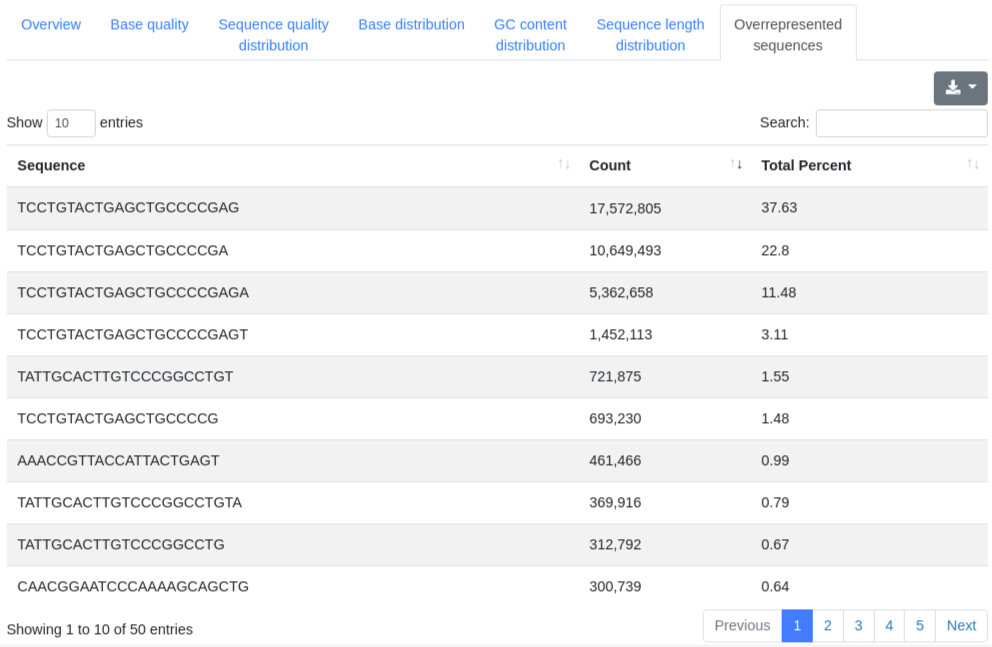
A table showing the 50 most frequently found sequences, displaying their sequence, count and percentage of all valid sequences.
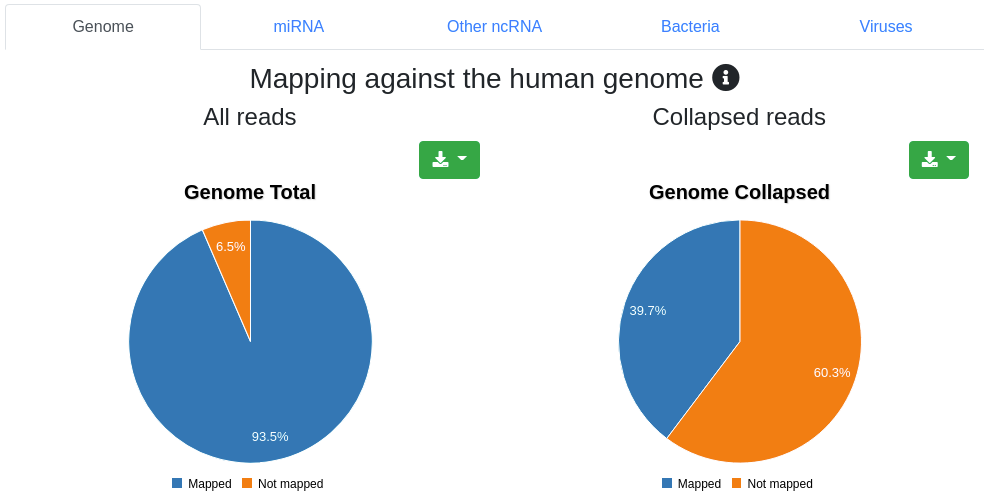
3 - Mapping
The mapping page provides information on the number of mapped sequences against different references. We report the mapping statistics regarding all reads on one hand, and regarding the collapsed reads (leading to only unique sequences and counting each as occurring only once) on the other. It is subdivided into five tabs.
Reads are mapped against the species' genome per default without mismatches in the first 18 nucleotides and reads mapping to more than 5 locations (per default) are discarded. Pie charts for the number and portion of reads mapping to the genome are shown.
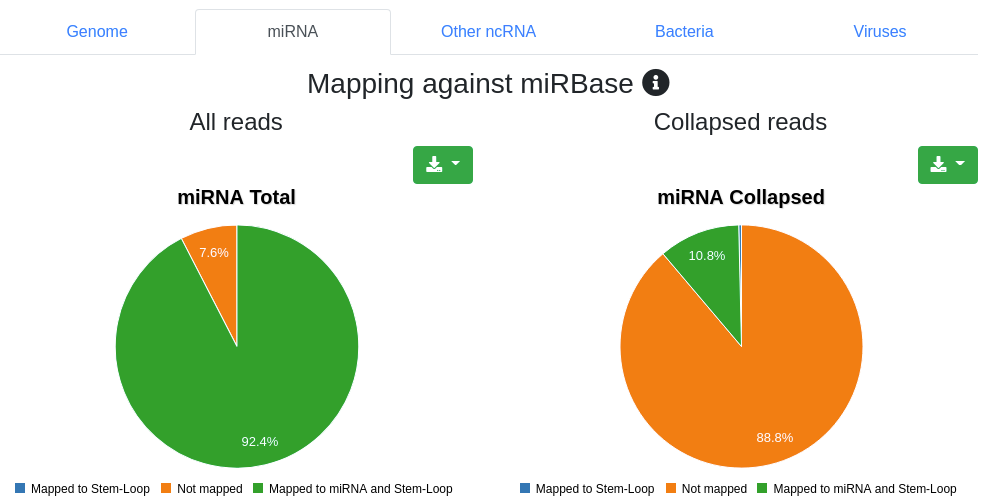
Reads are mapped against the species' miRBase v22 [1] while allowing per default one mismatch. We report the number and portion of reads mapping to known miRNAs within a 2 bases upstream and 5 bases downstream window. Further we report the portion of reads mapping exclusively to a miRBase stem-loop, but not to a miRNA.
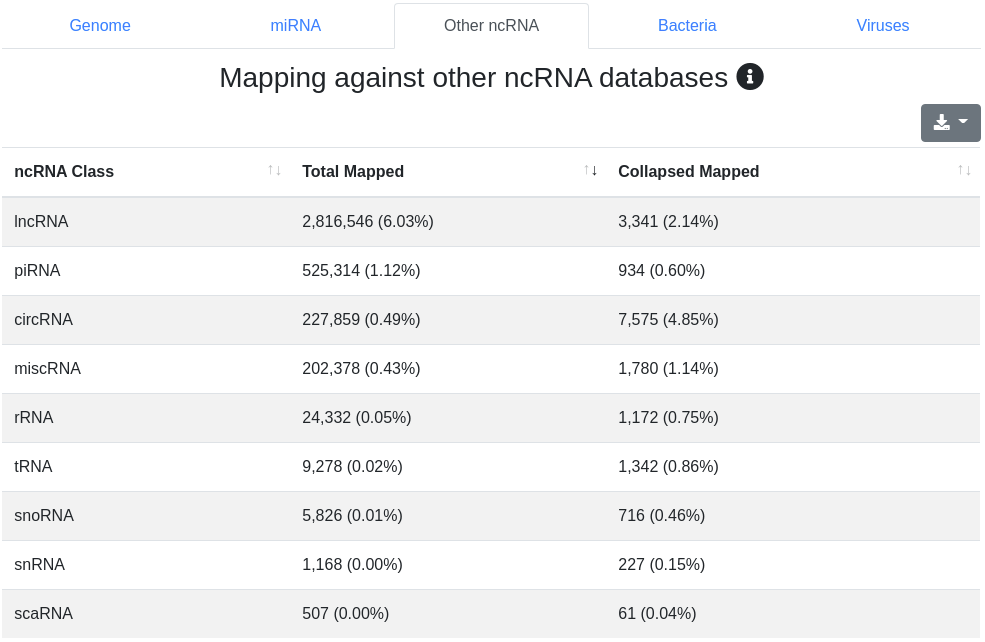
Reads are mapped against other ncRNAs of Ensembl (release 100) [2] without mismatches.
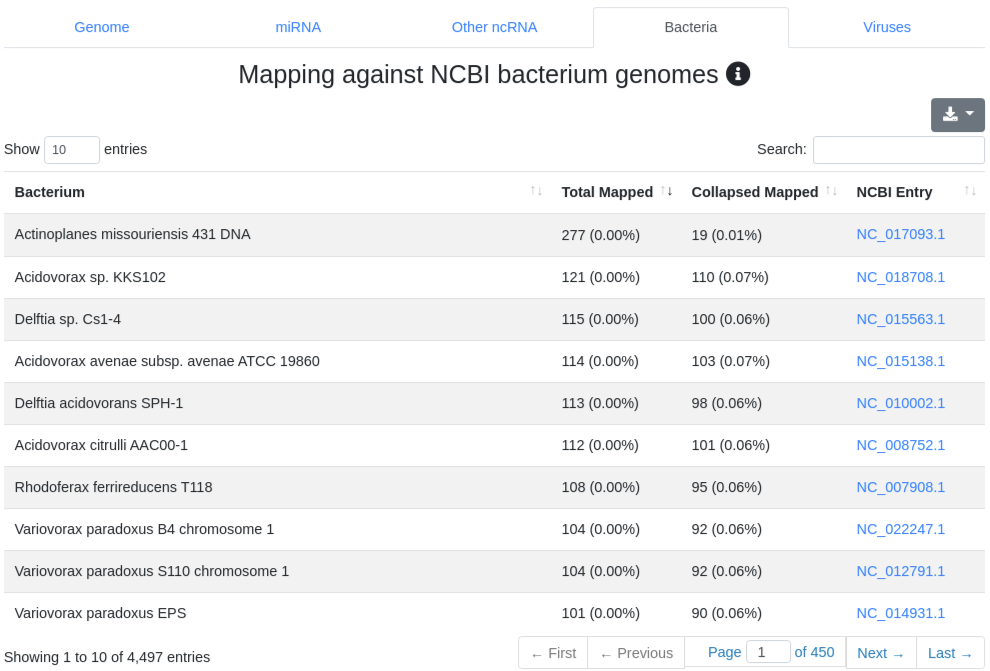
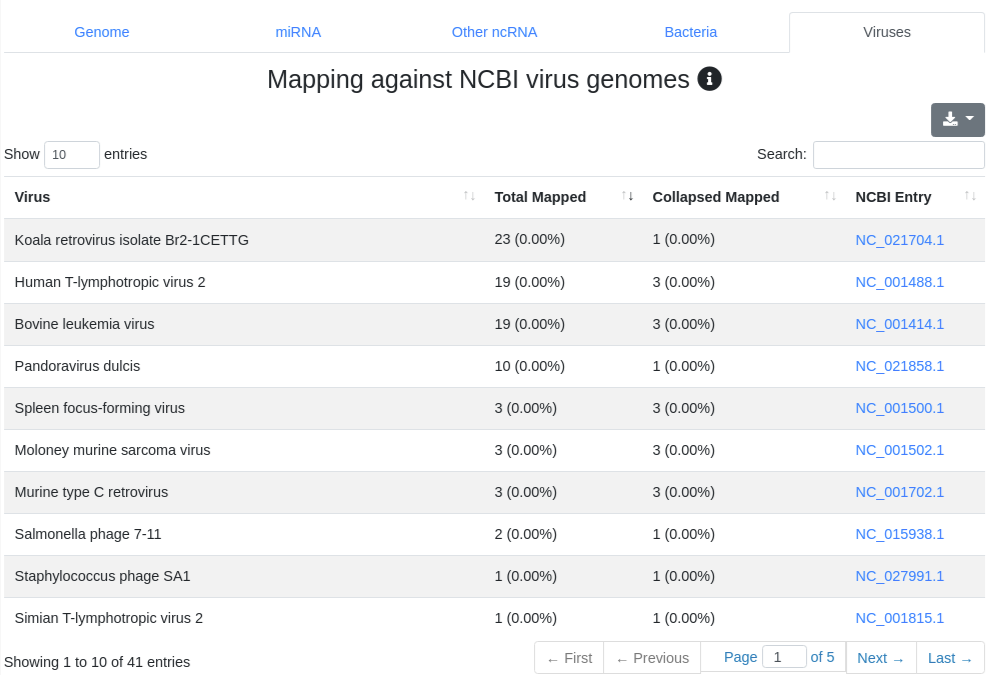
We map all reads that did not align to the species' genome with at most one mismatch) to all 7,556 bacteria and 7,026 virus sequences of NCBI RefSeq release 74 [3] and report the number of perfectly mapping reads. Reads mapping to bacteria or viruses can indicate exogenous miRNAs, but also reagent contamination or diseases such as sepsis.
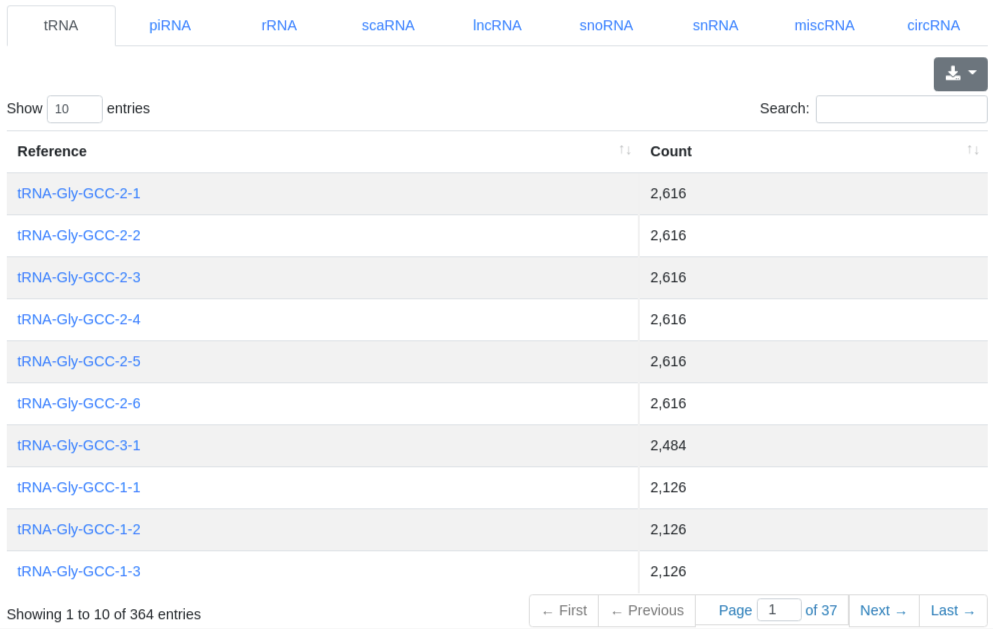
4 - Quantification other ncRNA
The ncRNA quantification page provides information about the amount of found known ncRNAs from GtRNAdb (tRNAs), RNACentral (piRNAs), Ensembl and circBase (circRNAs). It is subdivided into nine tabs.
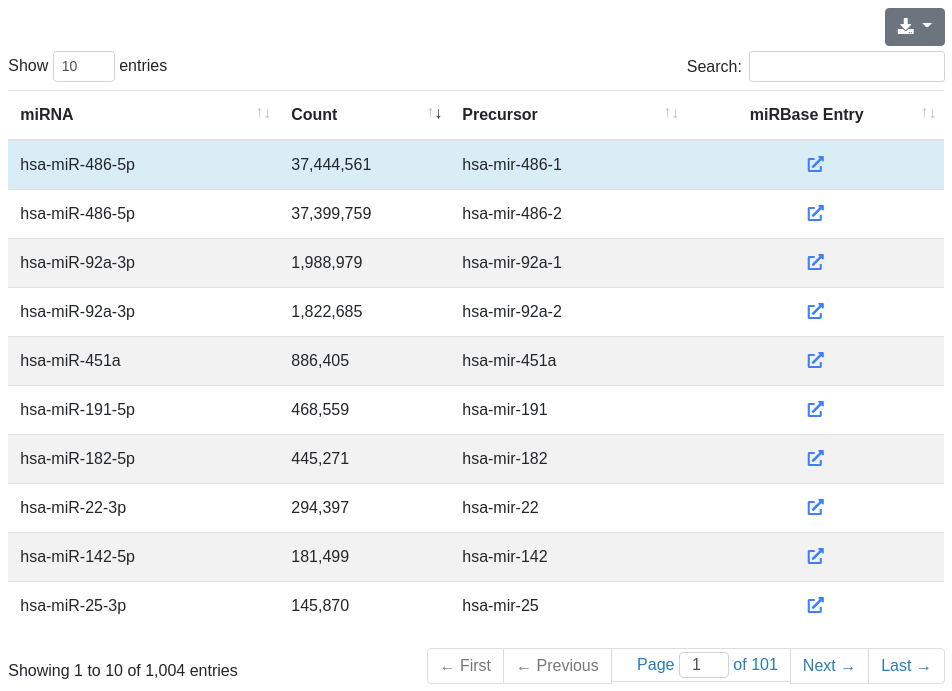
5 - Quantification miRNA
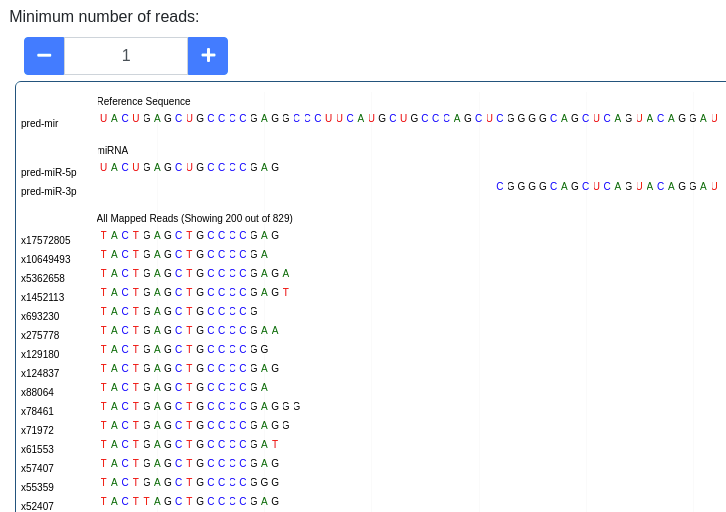
The miRNA quantification page provides information about the amount of found known miRNA sequences in the sample. All found known miRNAs are listed in a table and include the number of reads that mapped to them within a 2 bases upstream and 5 bases downstream window (per default).
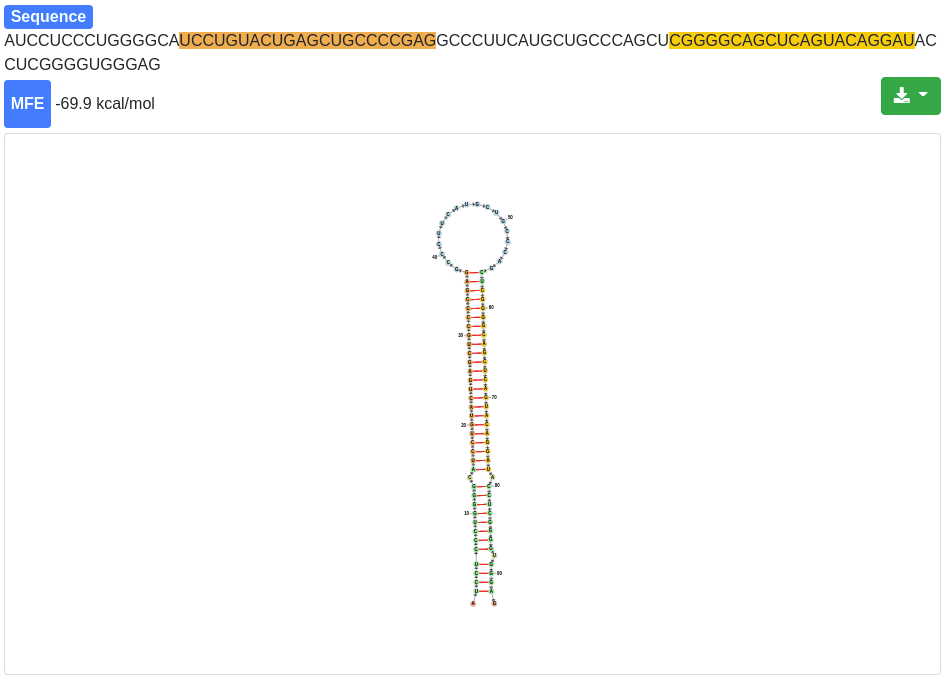
Each miRNA is clickable and additional information are provided for the selected miRNA and its precursor stem-loop. The sequence and the minimum free energy are reported, as well as the secondary structure. The secondary structure nucleotides are per default colored according to the type of structure they belong to:
Green:: Stems (canonical helices)
Red: Multiloops (junctions)
Yellow: Interior loops
Blue: Hairpin loops
Orange: 5' and 3' unpaired region
The 3' and 5' miRNA are highlighted specifically as well.
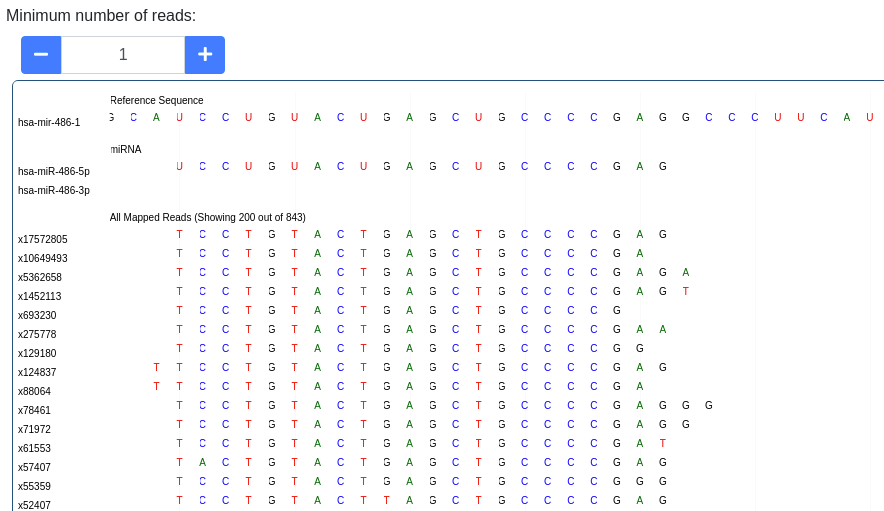
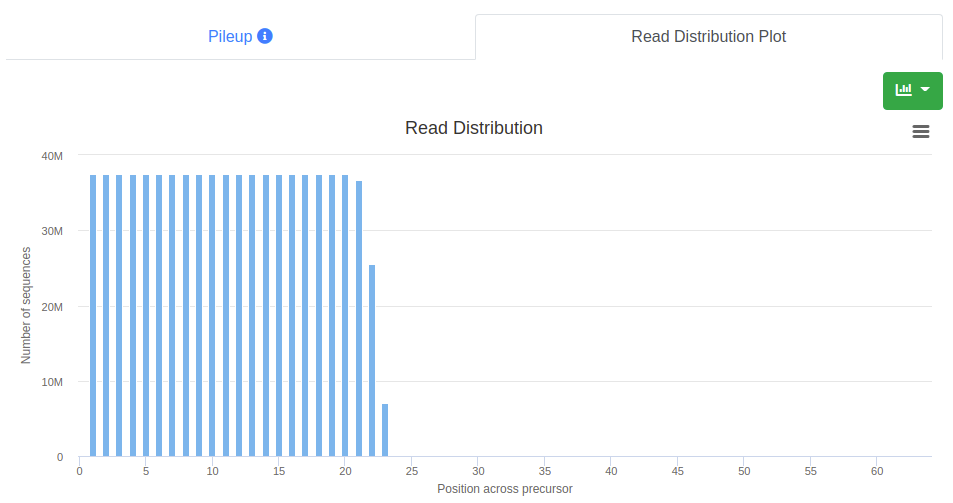
The pileup plot of the reads mapping to the stem-loop can be inspected. It can be filtered according to the minimum number of reads mapping to a position. Further the plot can be dragged and zoomed to visualize the exact sequences. The number of reads with a shown sequence is shown on the left of the pileup plot (e.g. x1234 is a read occuring 1,234 times).
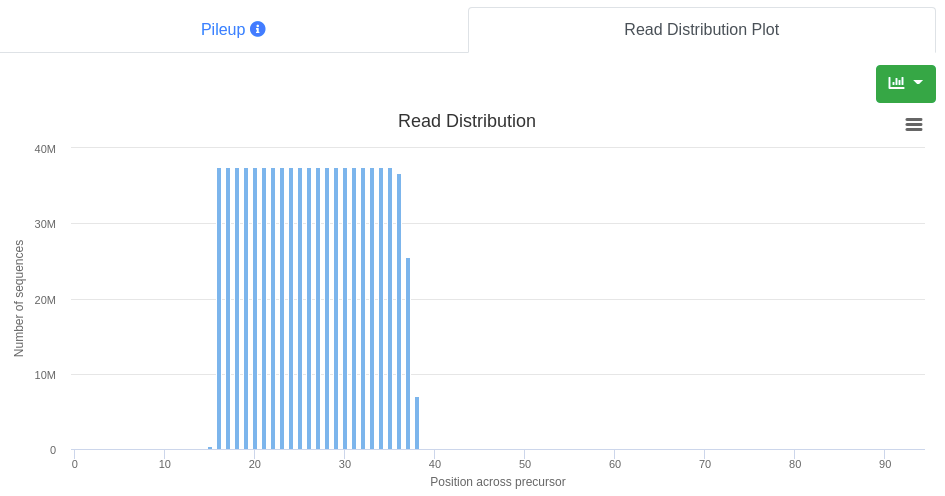
The read distribution on the precursor is visualized showing the total number of sequences mapping at each position. The distribution plot can be displayed either as bar plot or as area plot.
6 - Prediction
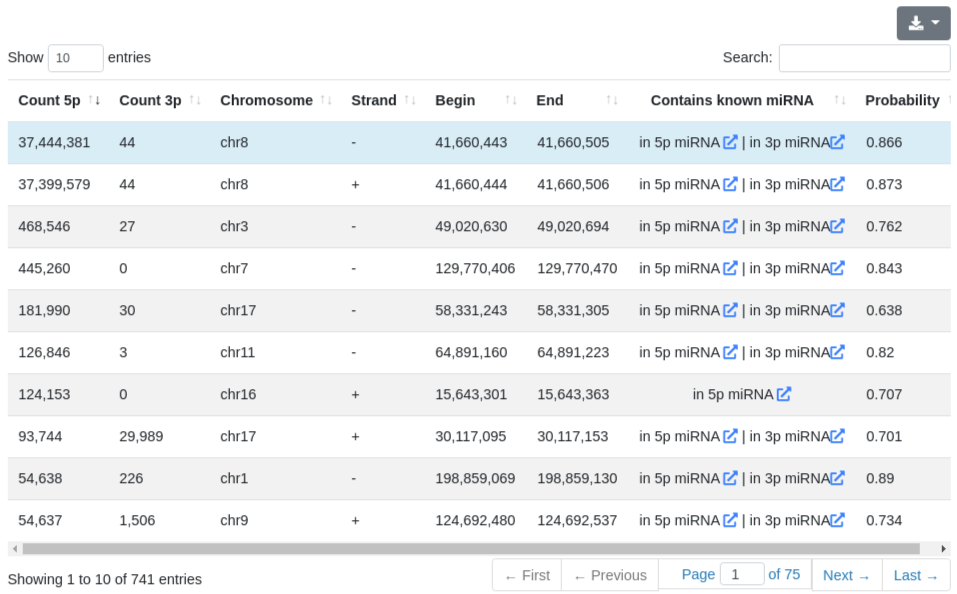
The prediction page provides information about the predicted precursors in the sample, before the merging step performed for the overall report. All predictions are listed in a table and include the number of reads mapping to the 5' and 3' predicted miRNAs, the genomic location of the precursor, its predicted probability of being a true precursor and whether it contains already known miRNAs. Since we don't exclude known precursors, many entries in this table will contain re-discovered known precursors.
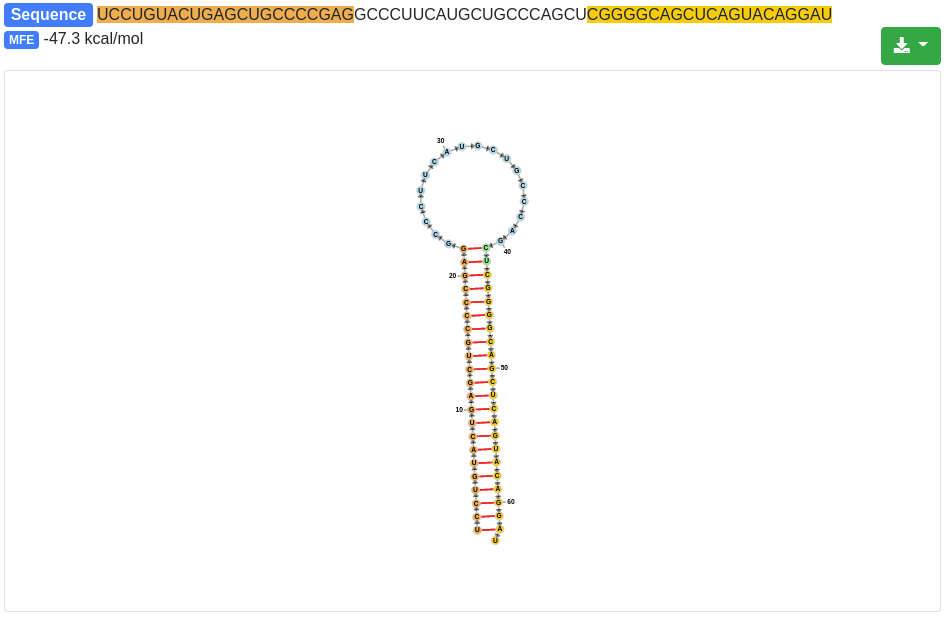
Each precursor is clickable and additional information are provided for the selected prediction, as in the quantification tab. The sequence and the minimum free energy are reported, as well as the secondary structure. The additional information can be shown for the precursor sequence (determined by the start of the 5' miRNA and the end of the 3' miRNA) and also for the precursor stem-loop which was determined during the precursor excision step.
The secondary structure nucleotides are per default colored according to the type of structure they belong to:
Green:: Stems (canonical helices)
Red: Multiloops (junctions)
Yellow: Interior loops
Blue: Hairpin loops
Orange: 5' and 3' unpaired region
The 3' and 5' miRNA are highlighted specifically as well.
The pileup plot of the reads mapping to the precursor/stem-loop can be inspected. It can be filtered according to the minimum number of reads mapping to a position. Further the plot can be dragged and zoomed to visualize the exact sequences. The number of reads with a shown sequence is shown on the left of the pileup plot (e.g. x1234 is a read occuring 1,234 times).
The read distribution on the precursor/stem-loop is visualized showing the total number of sequences mapping at each position. The distribution plot can be displayed either as bar plot or as area plot.
Overall report (example)
The report is divided into six categories. It is built similar to the single sample report. All plots and tables can be downloaded in multiple formats (png, svg, pdf, csv, xlsx). For all except the first category at least an overview table is shown. A detailed per sample table is available for the same categories as well, however it is hidden by default to allow faster page loading. The overview table provides the median, mean, standard deviation and coefficient of variation for each provided information. If groups were specified the measures are provided for each group.
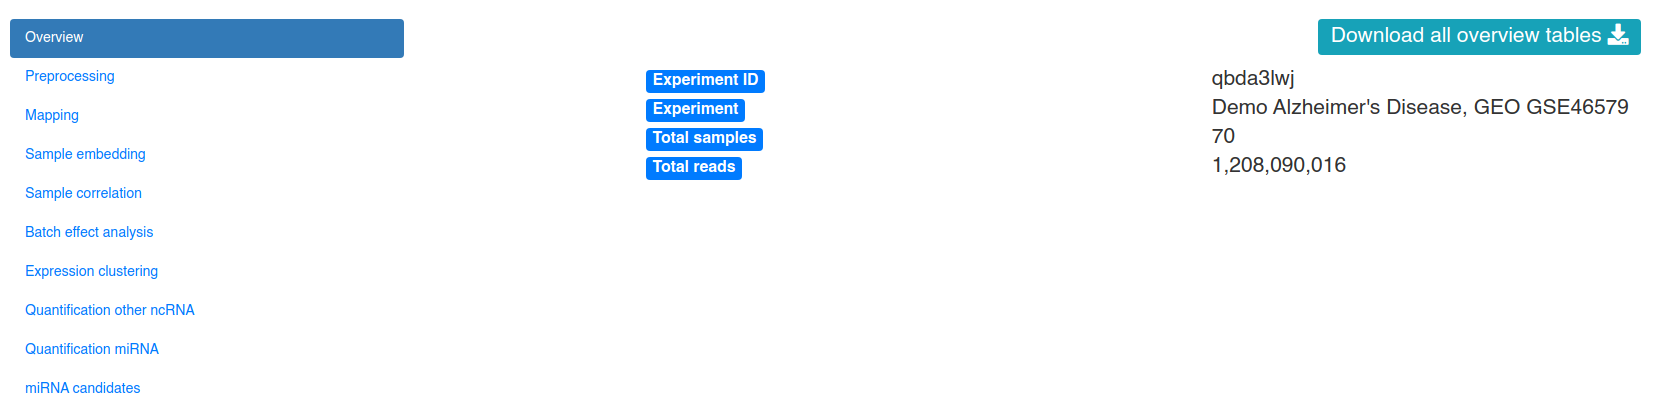
1 - Overview
The overview page provides information about the experiment id, name, the total number of analyzed samples and reads.
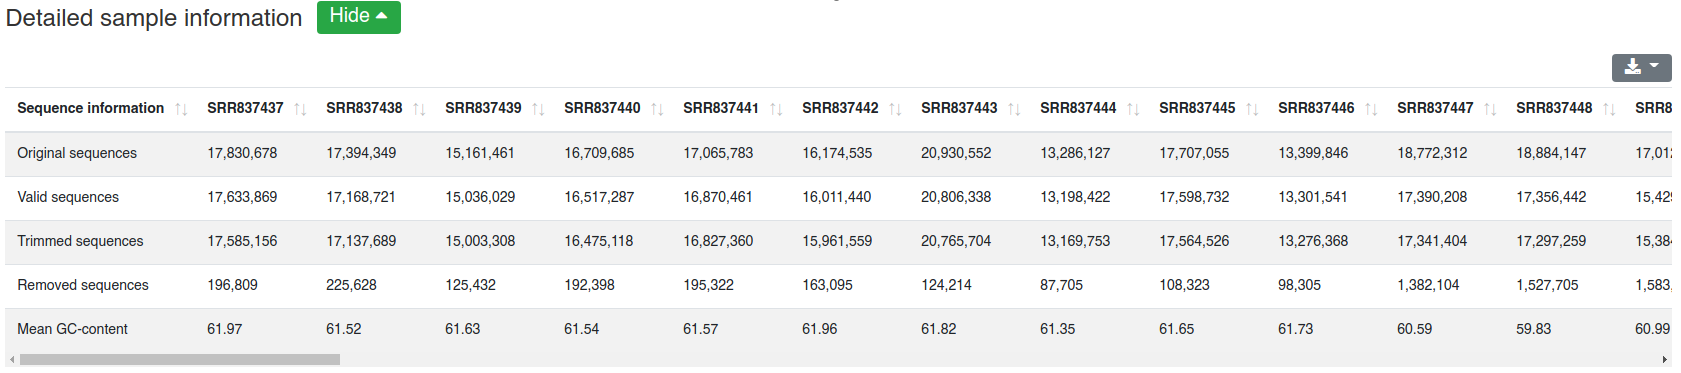
2 - Preprocessing
The preprocessing page provides information about the preprocessing of the sequences and their mean GC content.
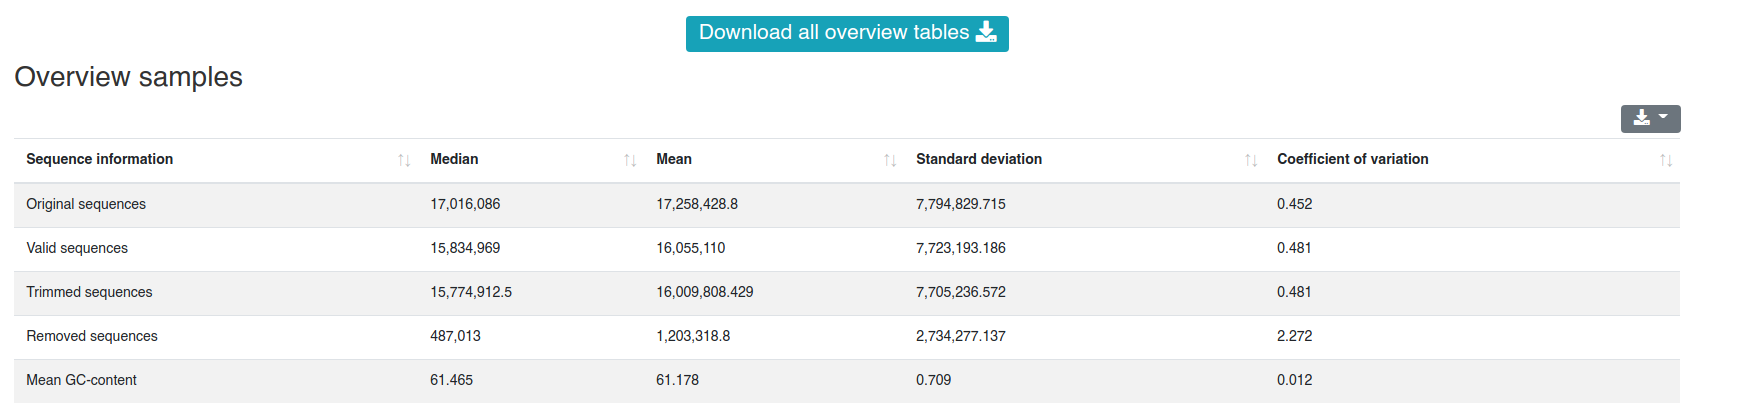
The detailed sample information table shows all numbers per sample.
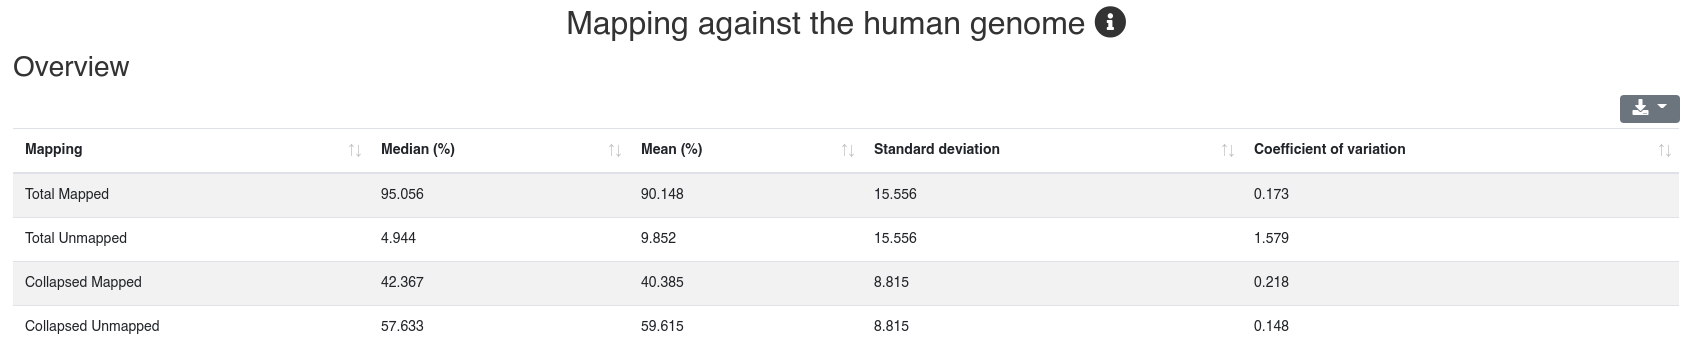
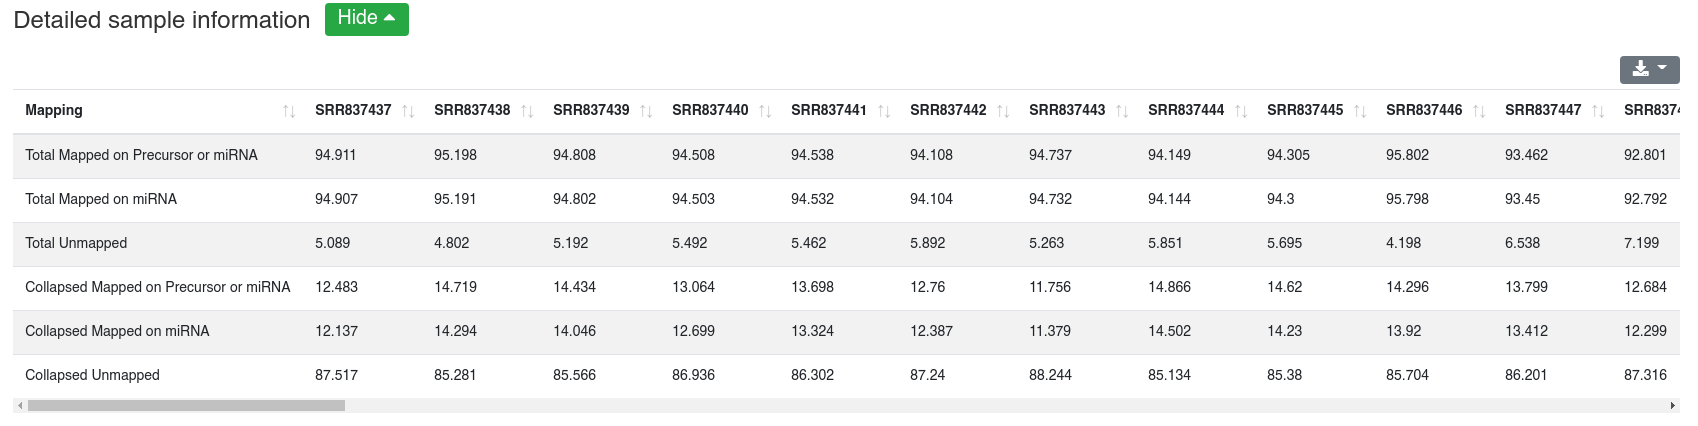
3 - Mapping
The mapping page provides information on the number of mapped sequences against different references. It is subdivided into five tabs.
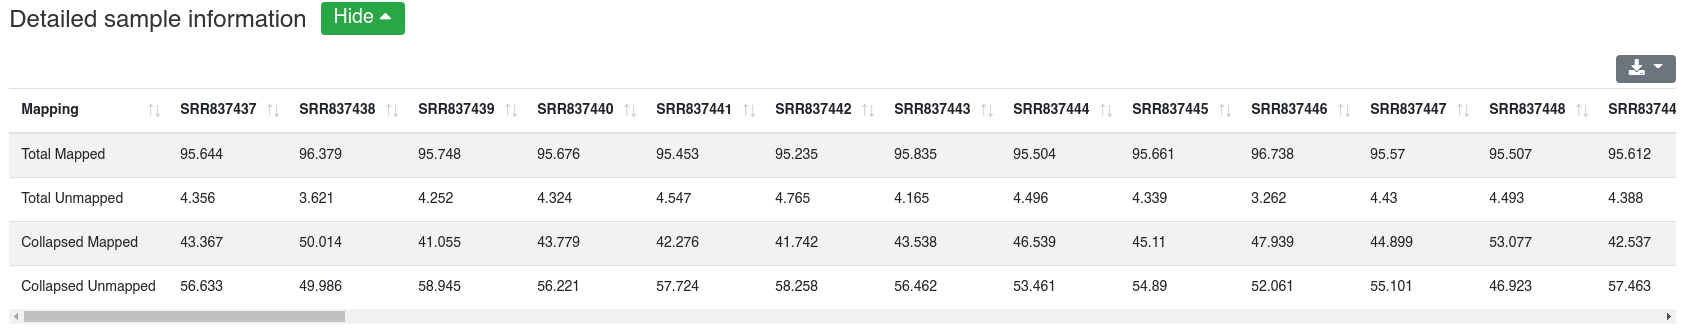
Reads are mapped against the species' genome per default without mismatches in the first 18 nucleotides and reads mapping to more than 5 locations (per default) are discarded. We report the mapping statistics regarding all reads on one hand, and regarding the collapsed reads (leading to only unique sequences and counting each as occurring only once) on the other.
The detailed sample information table shows all mapping statistics per sample.
Reads are mapped against the species' miRBase v22 [1] while allowing one mismatch per default. We report the number and portion of reads mapping to known miRNAs within a 2 bases upstream and 5 bases downstream window. Further we report the portion of reads mapping exclusively to a miRBase stem-loop, but not to a miRNA.
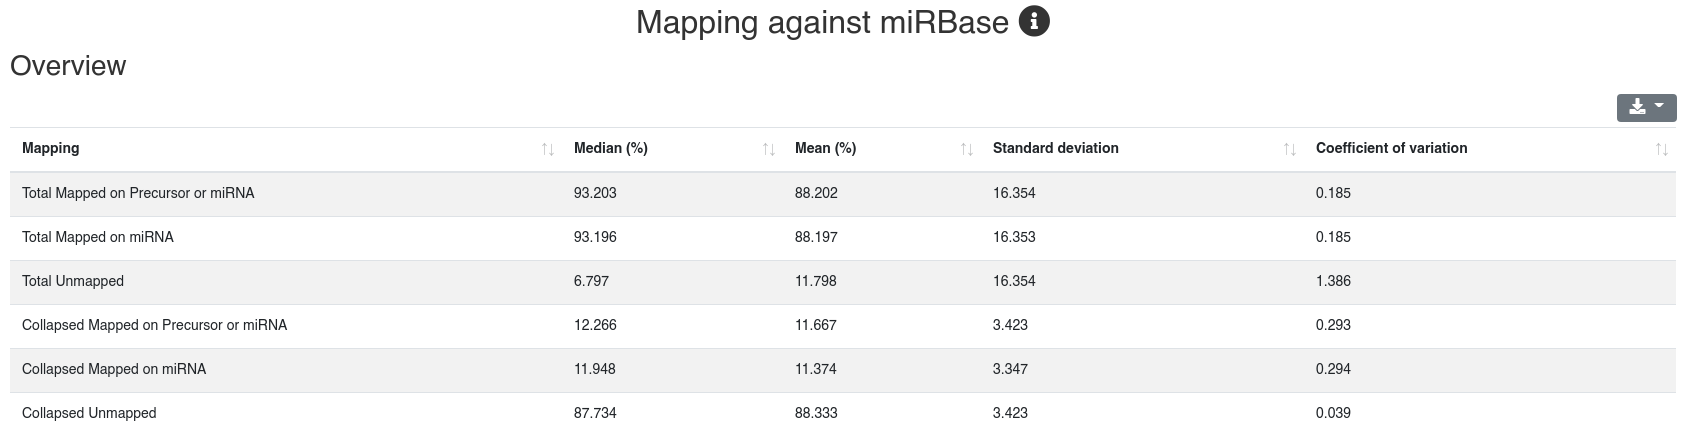
The detailed sample information table shows all mapping statistics per sample.
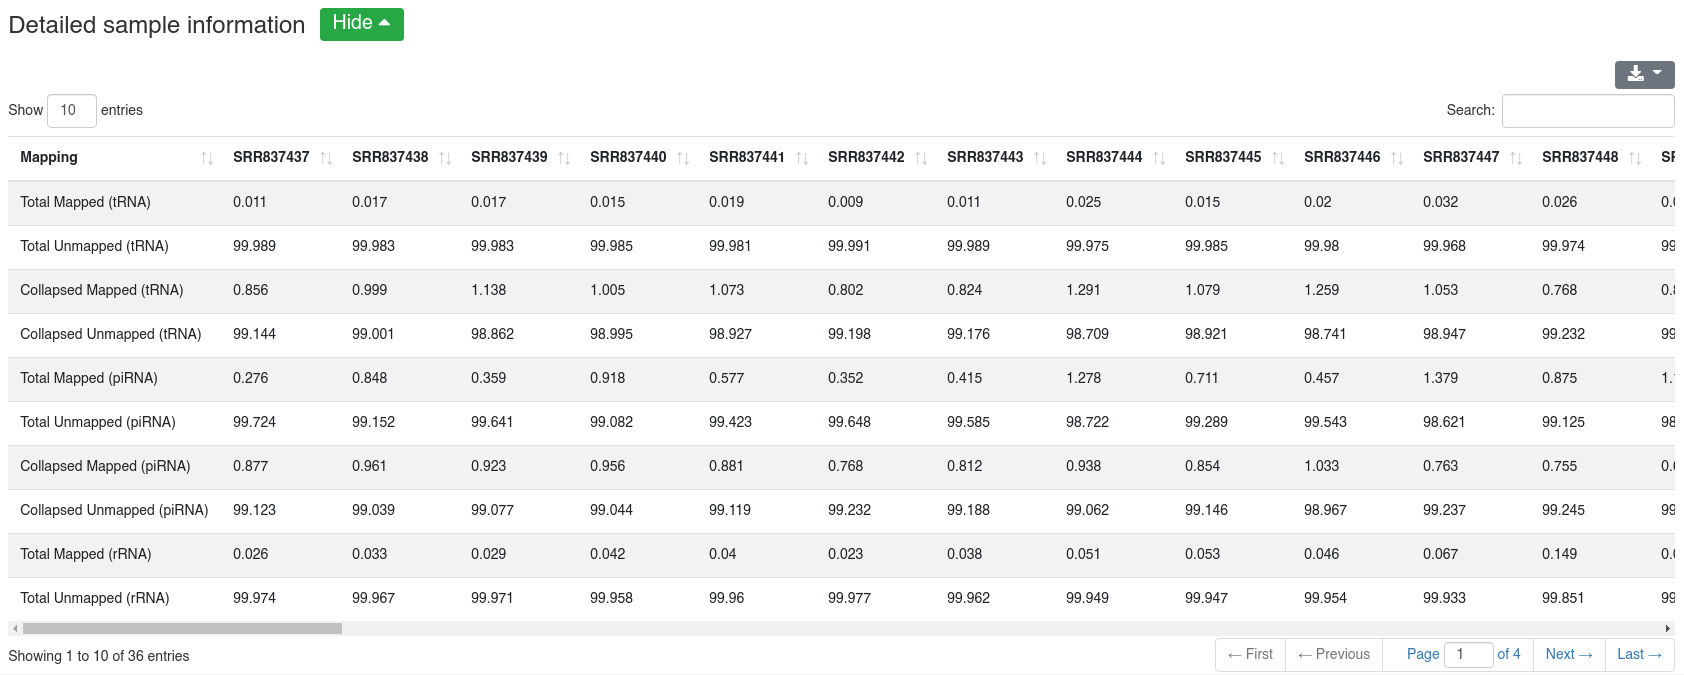
Reads are mapped against other ncRNAs of Ensembl (release 100) [2] without mismatches per default.
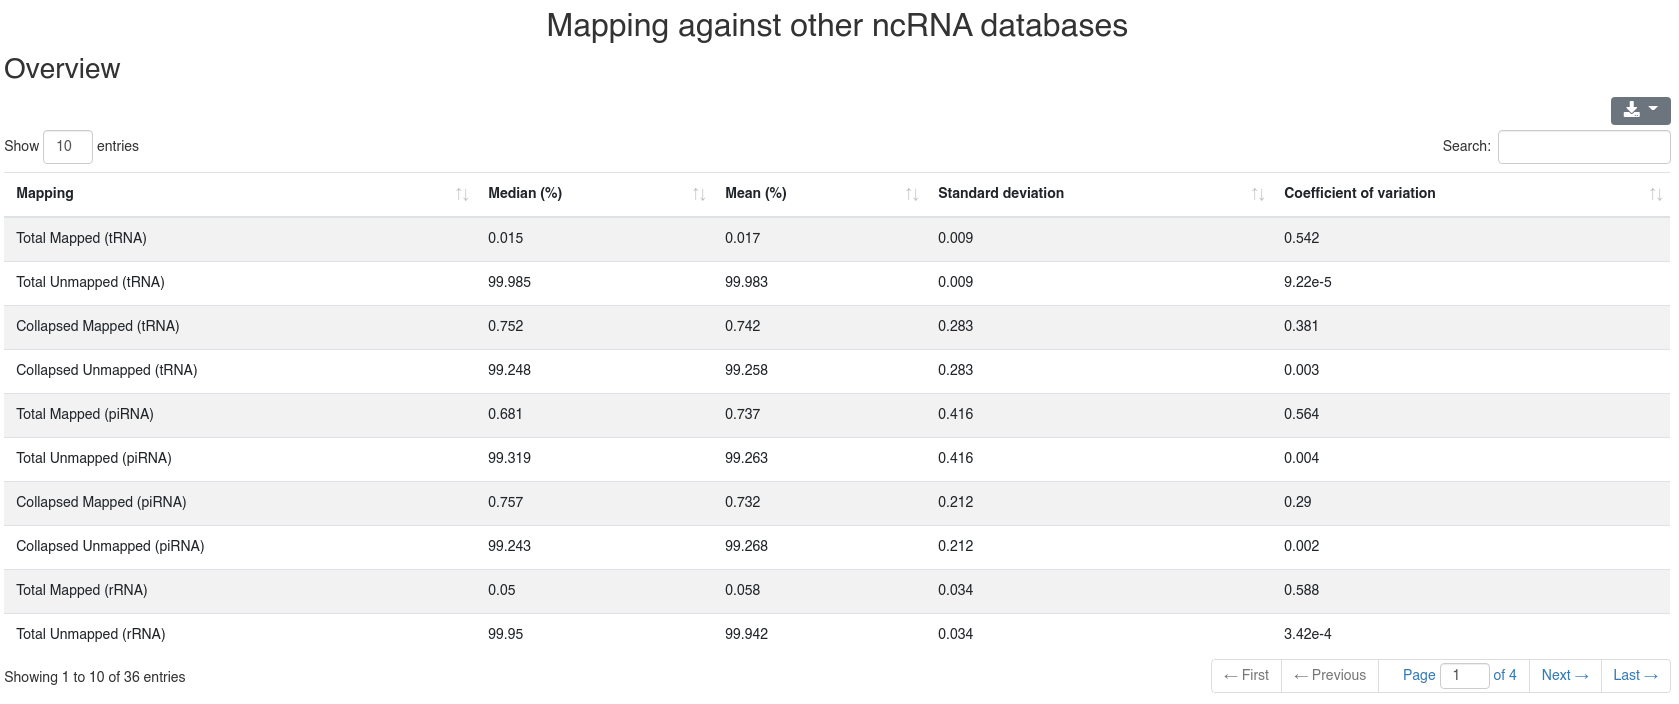
The detailed sample information table shows all mapping statistics per sample.
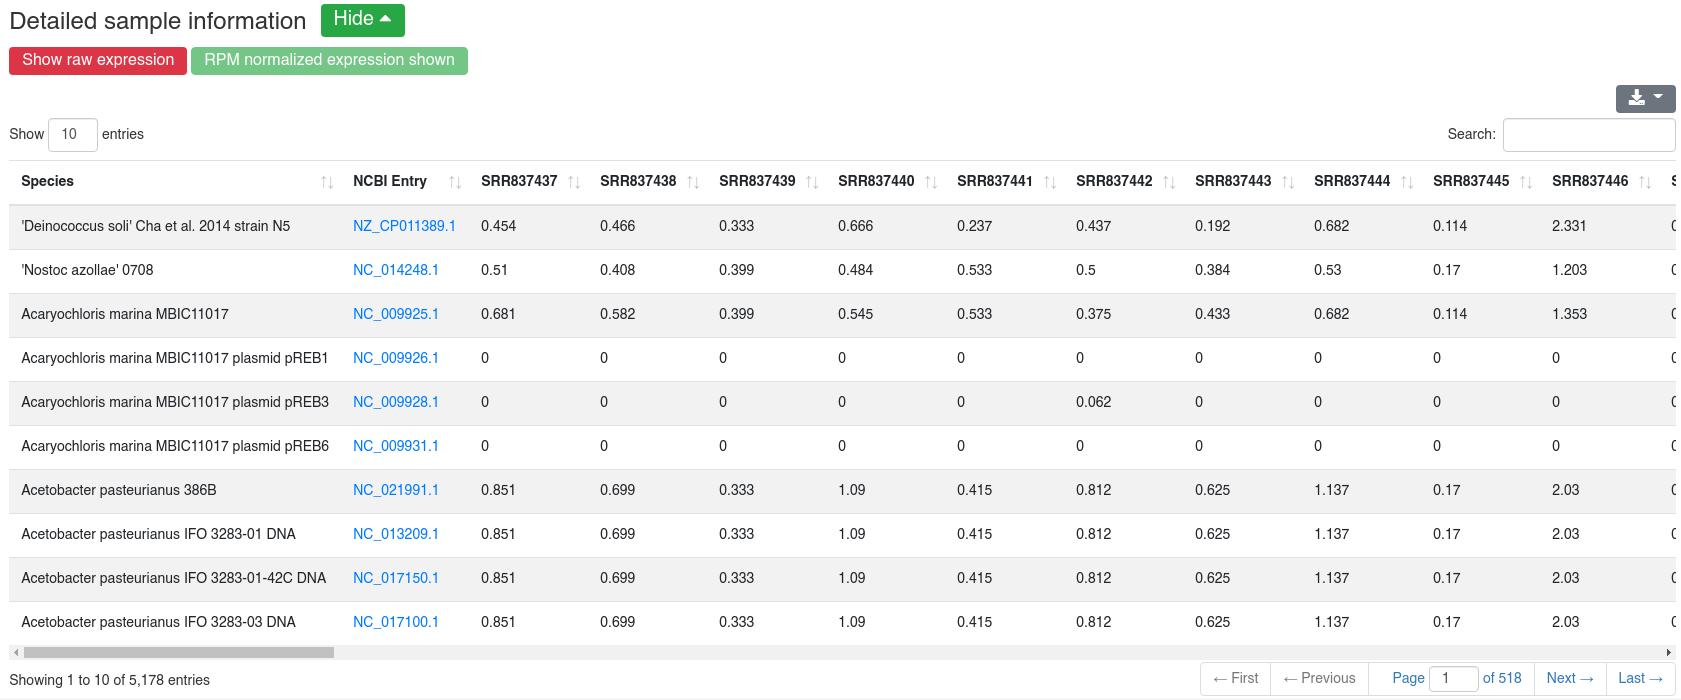
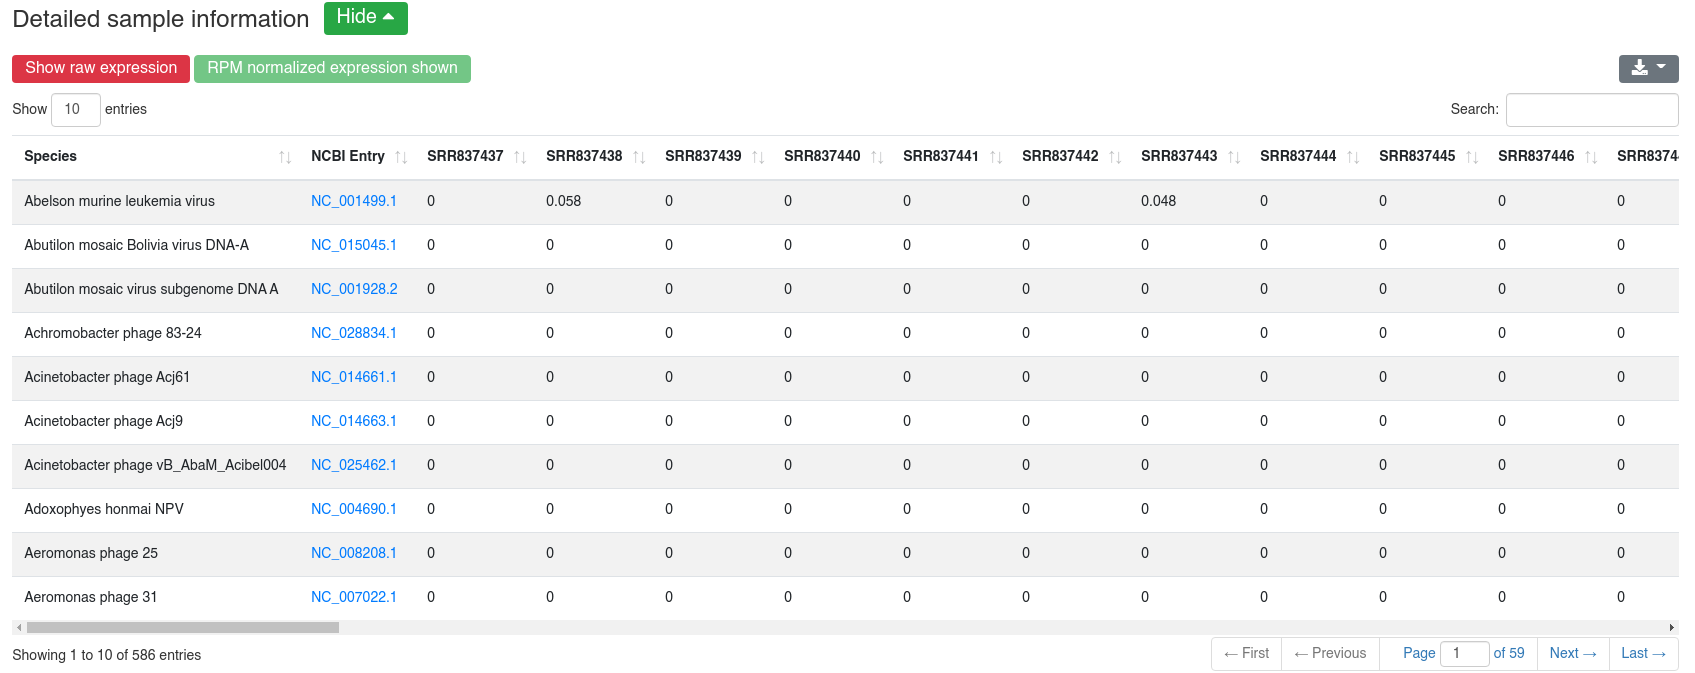
We map all reads that did not align to the species' genome with at most one mismatch to all 7,556 bacteria and 7,026 virus sequences of NCBI RefSeq release 74 [3] and report how many reads per million (RPM) are perfectly mapping to each species. Reads mapping to bacteria or viruses can indicate exogenous miRNAs, but also reagent contamination or diseases such as sepsis.
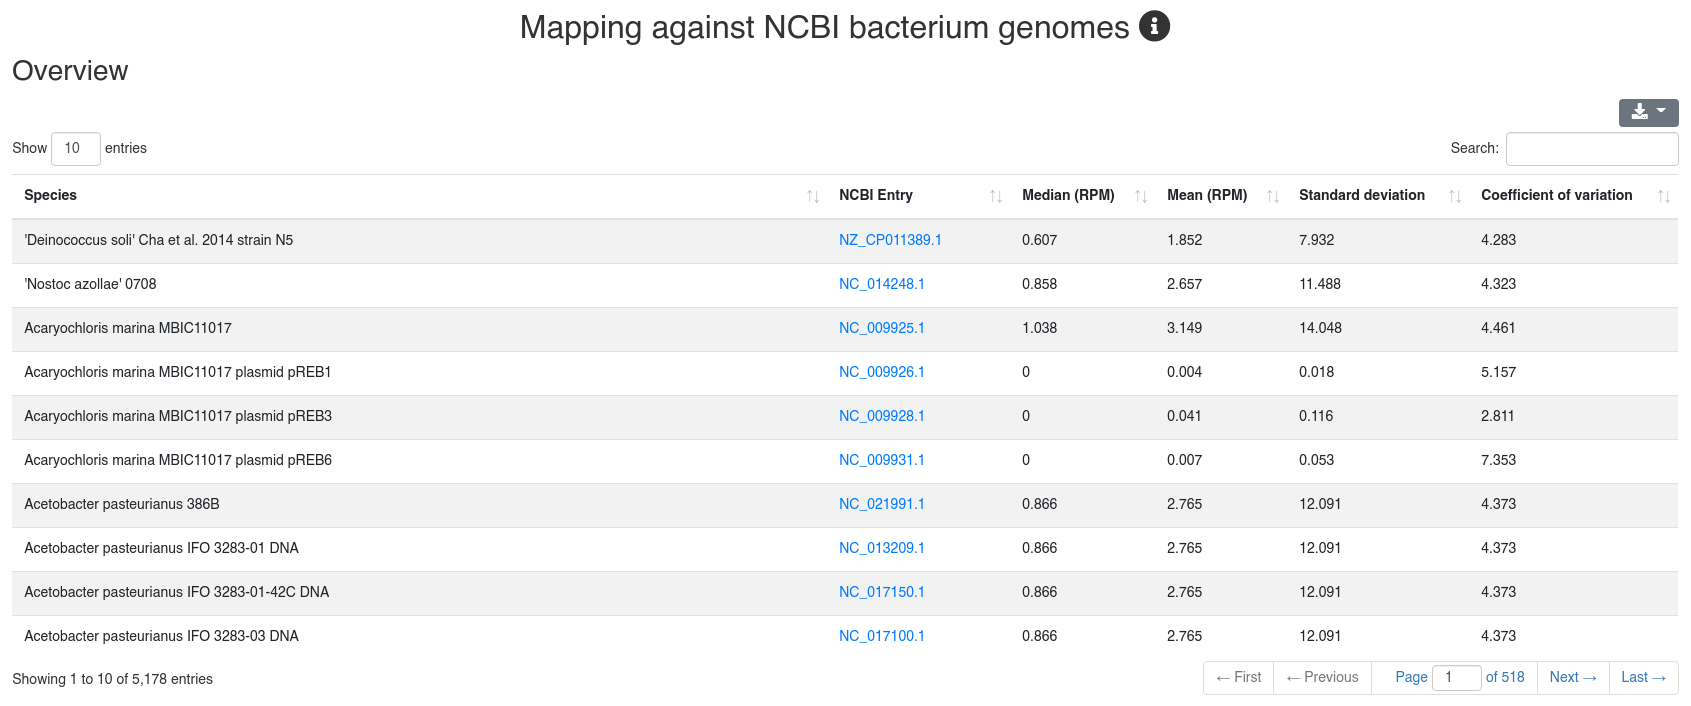
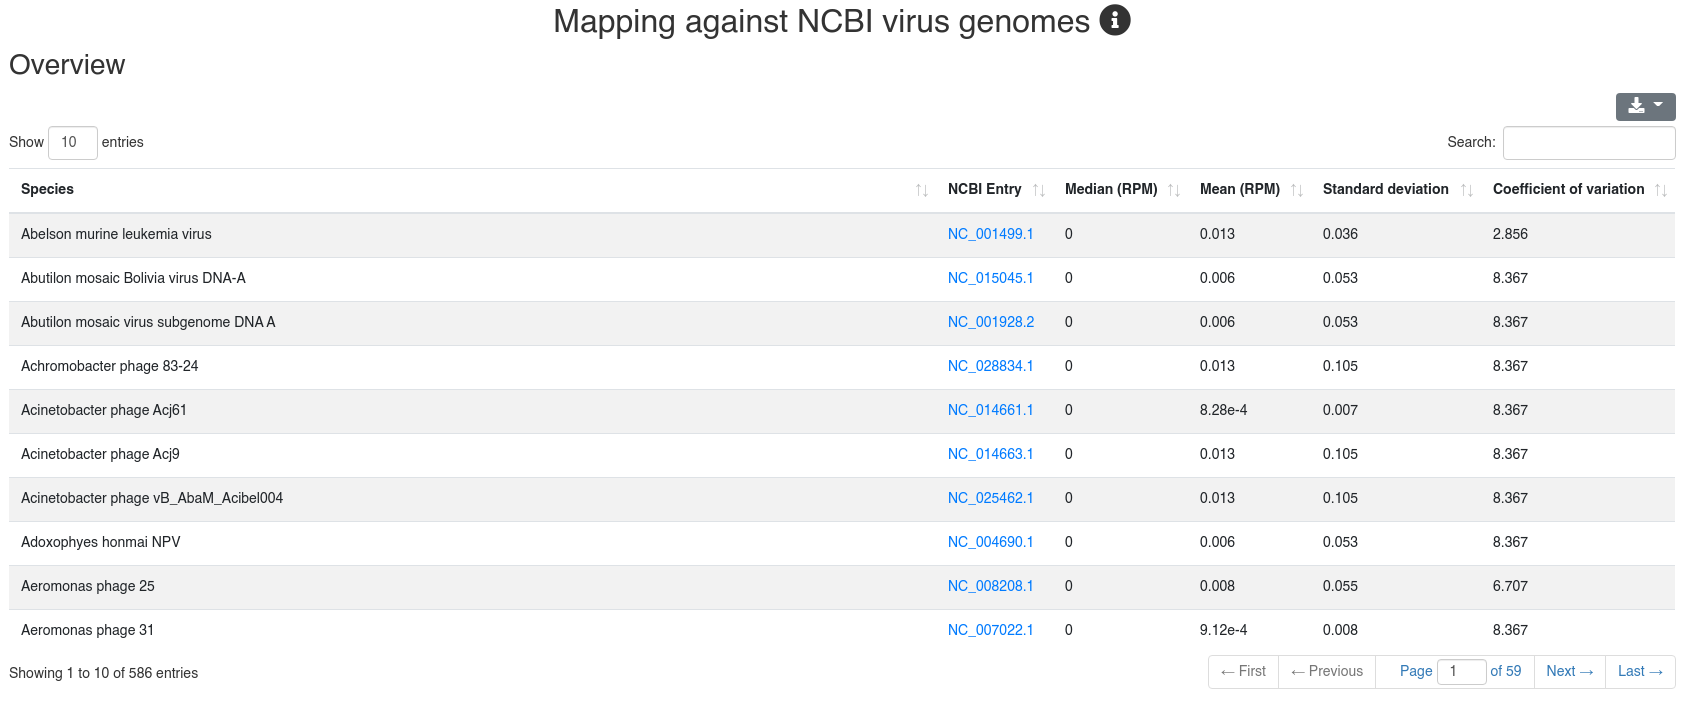
The detailed sample information table shows all mapping statistics per sample.
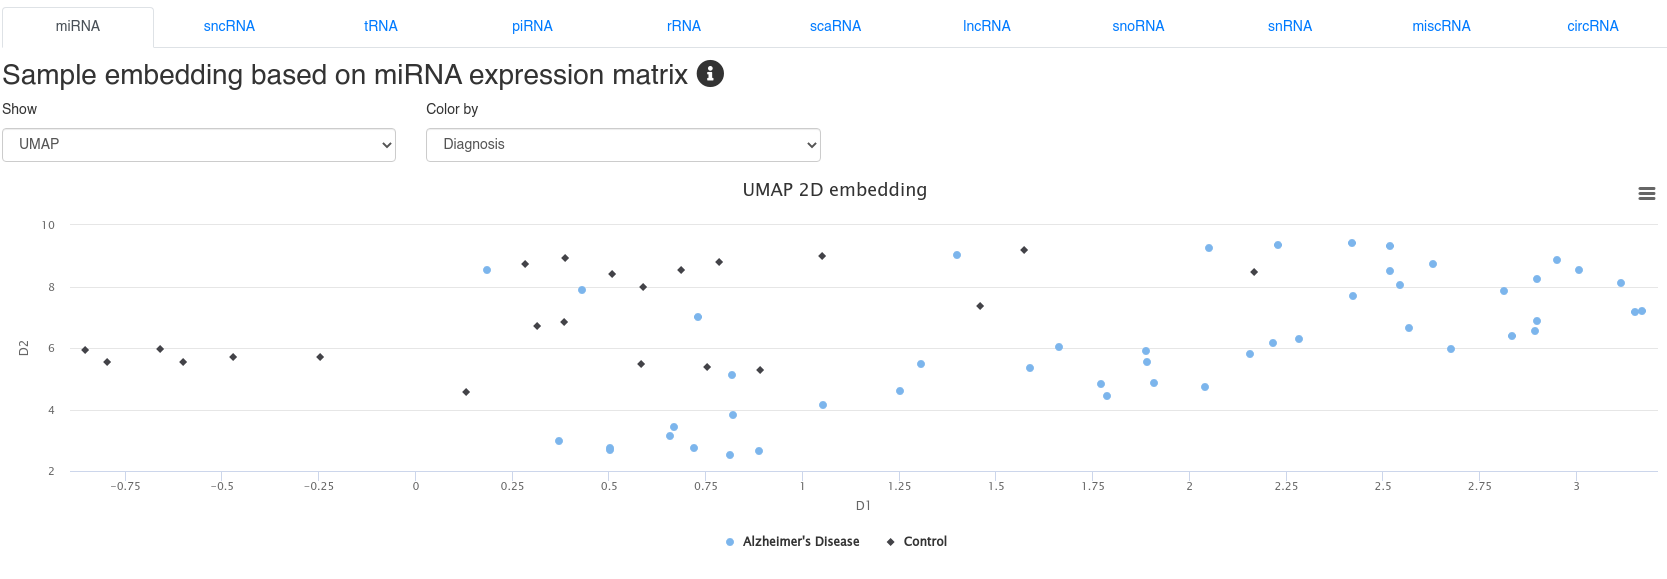
4 - Sample embedding
The sample embedding page shows 2D embeddings (UMAP or PCA) derived from the expression of different types of small non-coding RNAs. The plots can be colored by annotations provided during the upload. The embeddings allow to identify sample clusters and to detect outliers.
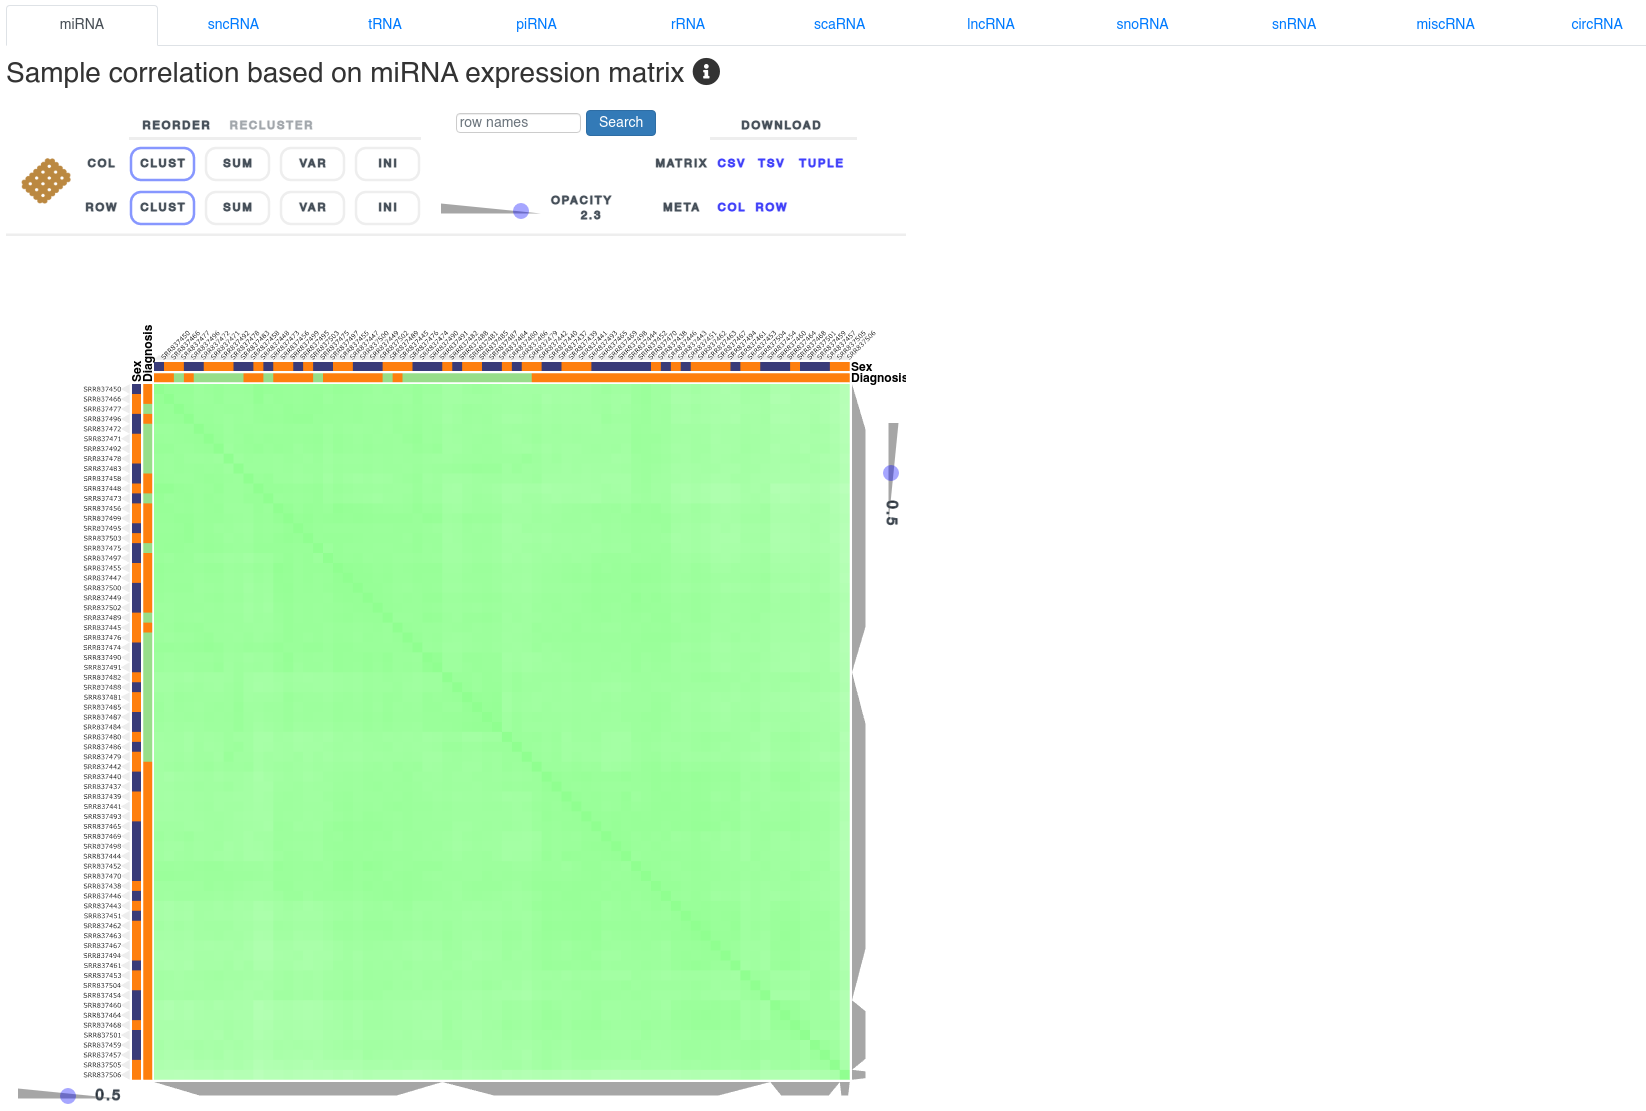
5 - Sample correlation
The sample correlation page shows the sample to sample spearman correlation using clustered heatmaps based on the expression of different types of small non-coding RNAs. It allows to identify clusters according to the uploaded annotations and outliers. The heatmap can be reordered and reclustered using the control interface above it.
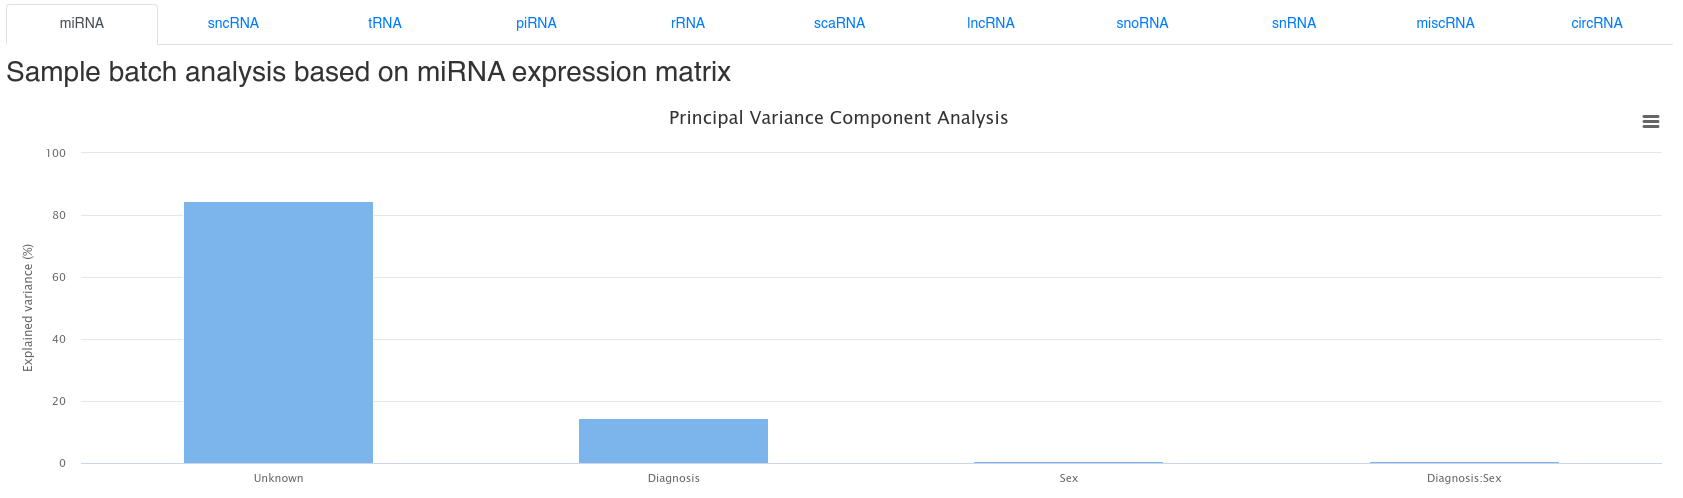
6 - Batch effect analysis
The bacth effect analysis page shows the results of a Principal Variance Component Analysis based on the uploaded sample annotations. It is common that a large part of the variance cannot be explained.
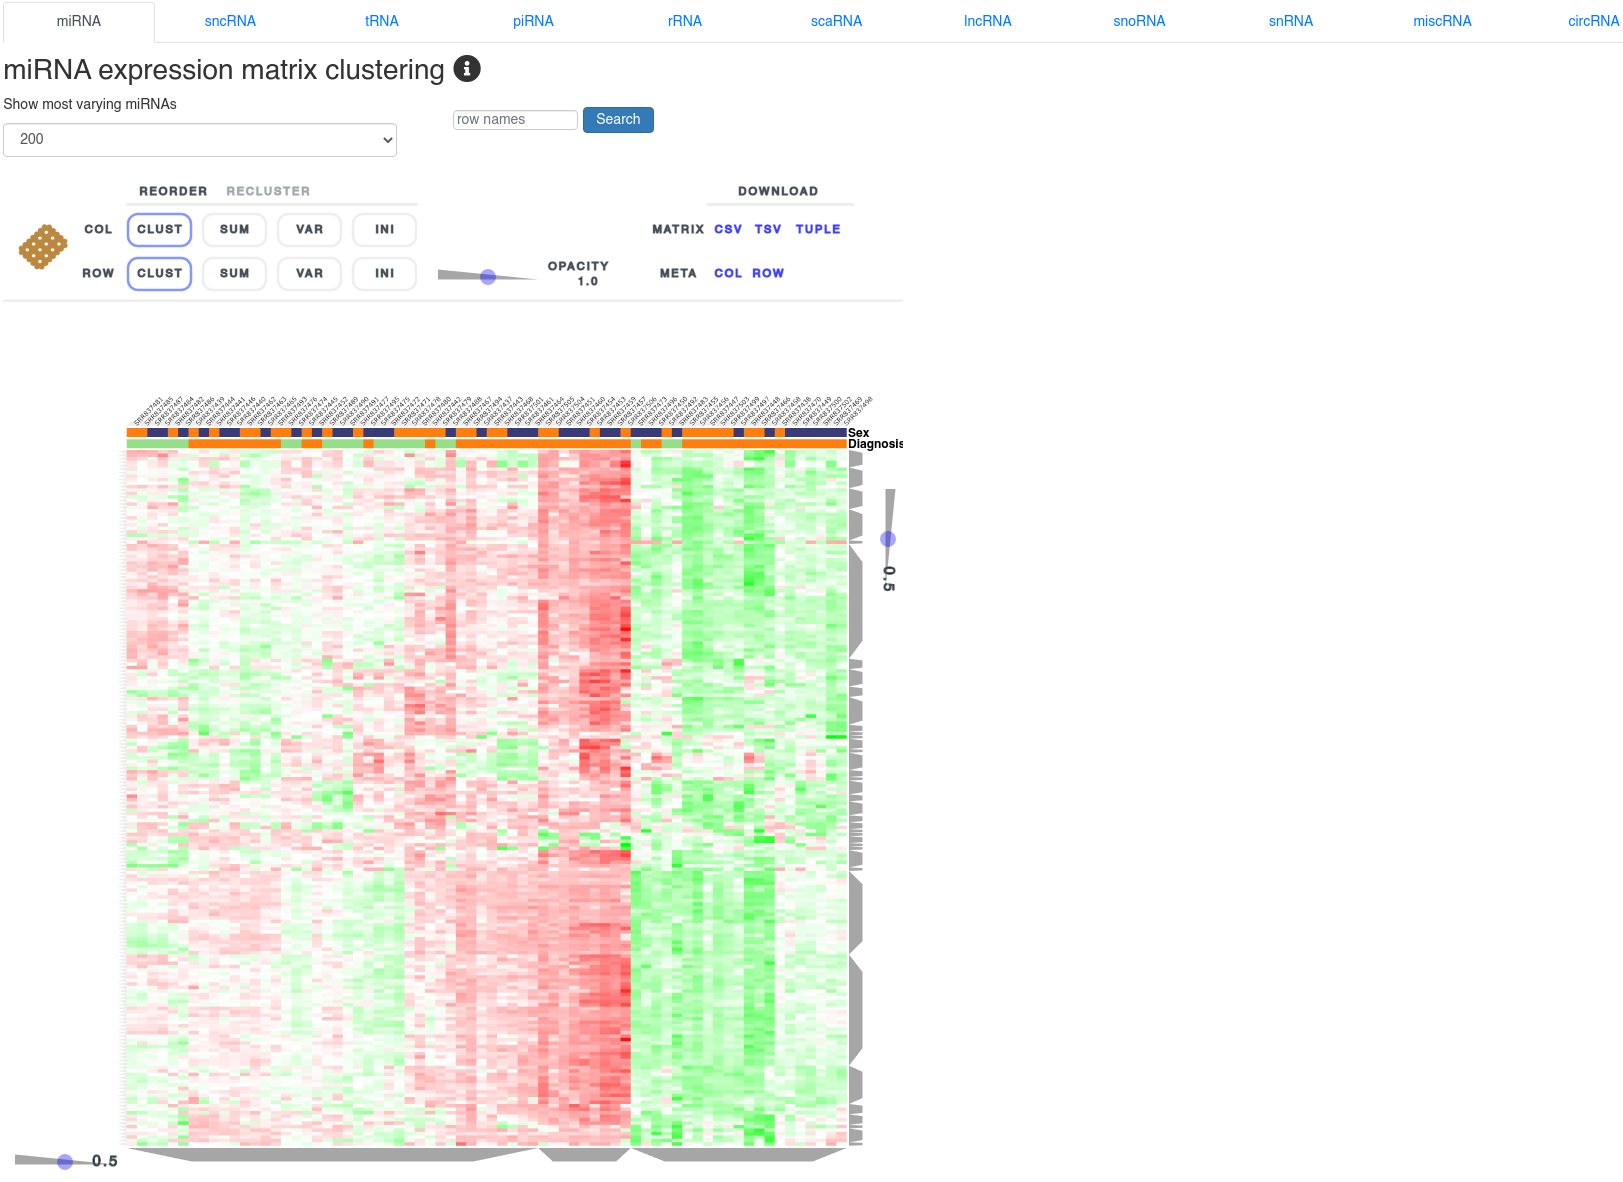
7 - Expression clustering
The expression clustering page shows a clustered heatmap of Z-score normalized expression values of different small non-coding RNAs. It allows to identify RNAs correlated with the user provided annotations. The cluster composition can be inspected by clicking the grey trapezoids. The heatmap can be reordered and reclustered using the control interface above it.
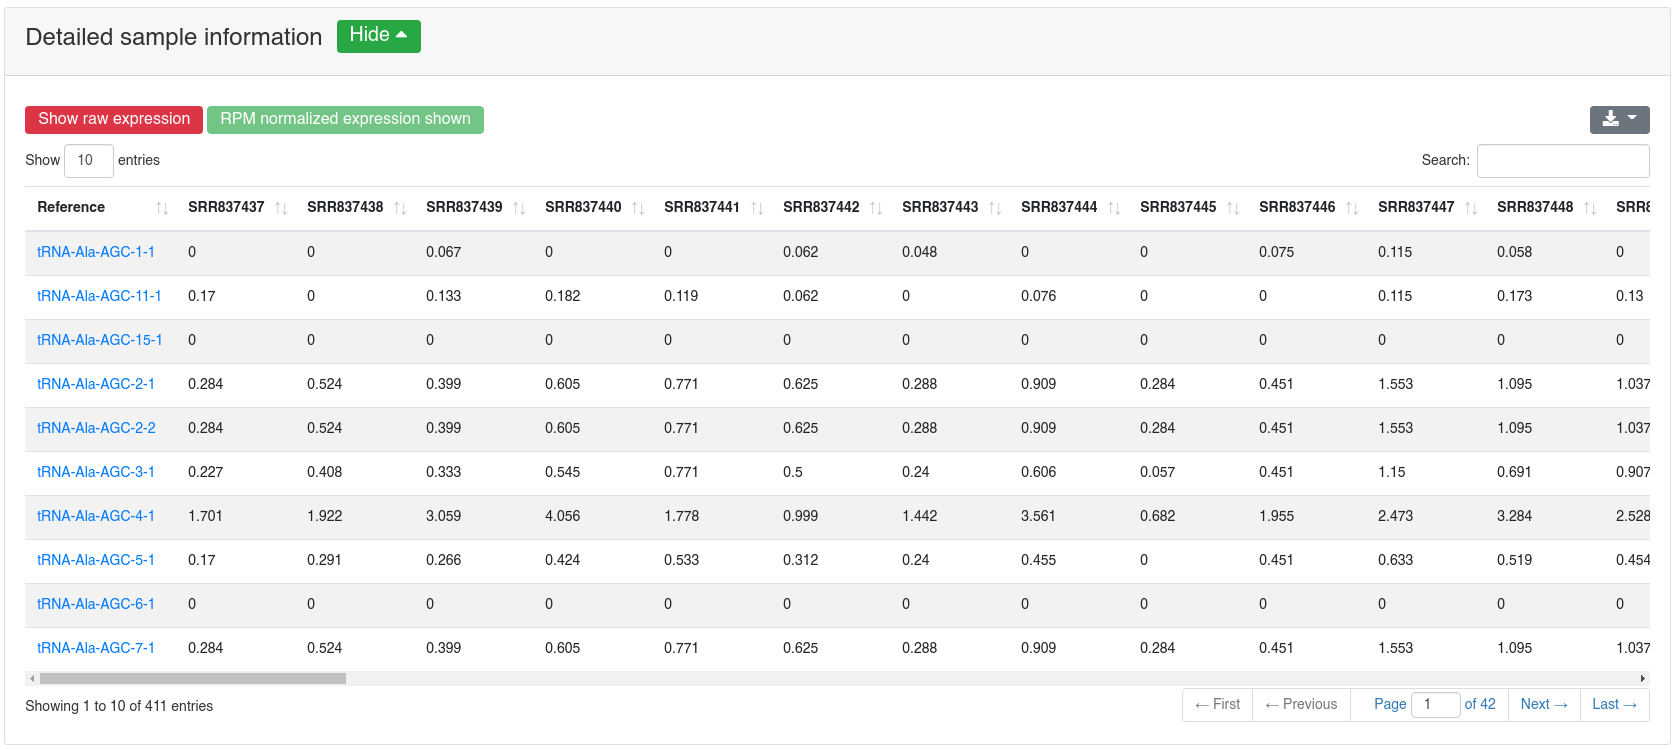
8 - Quantification other ncRNA
The ncRNA quantification page provides information about the amount of found known ncRNAs from GtRNAdb (tRNAs), RNACentral (piRNAs), Ensembl and circBase (circRNAs). It is subdivided into nine tabs.
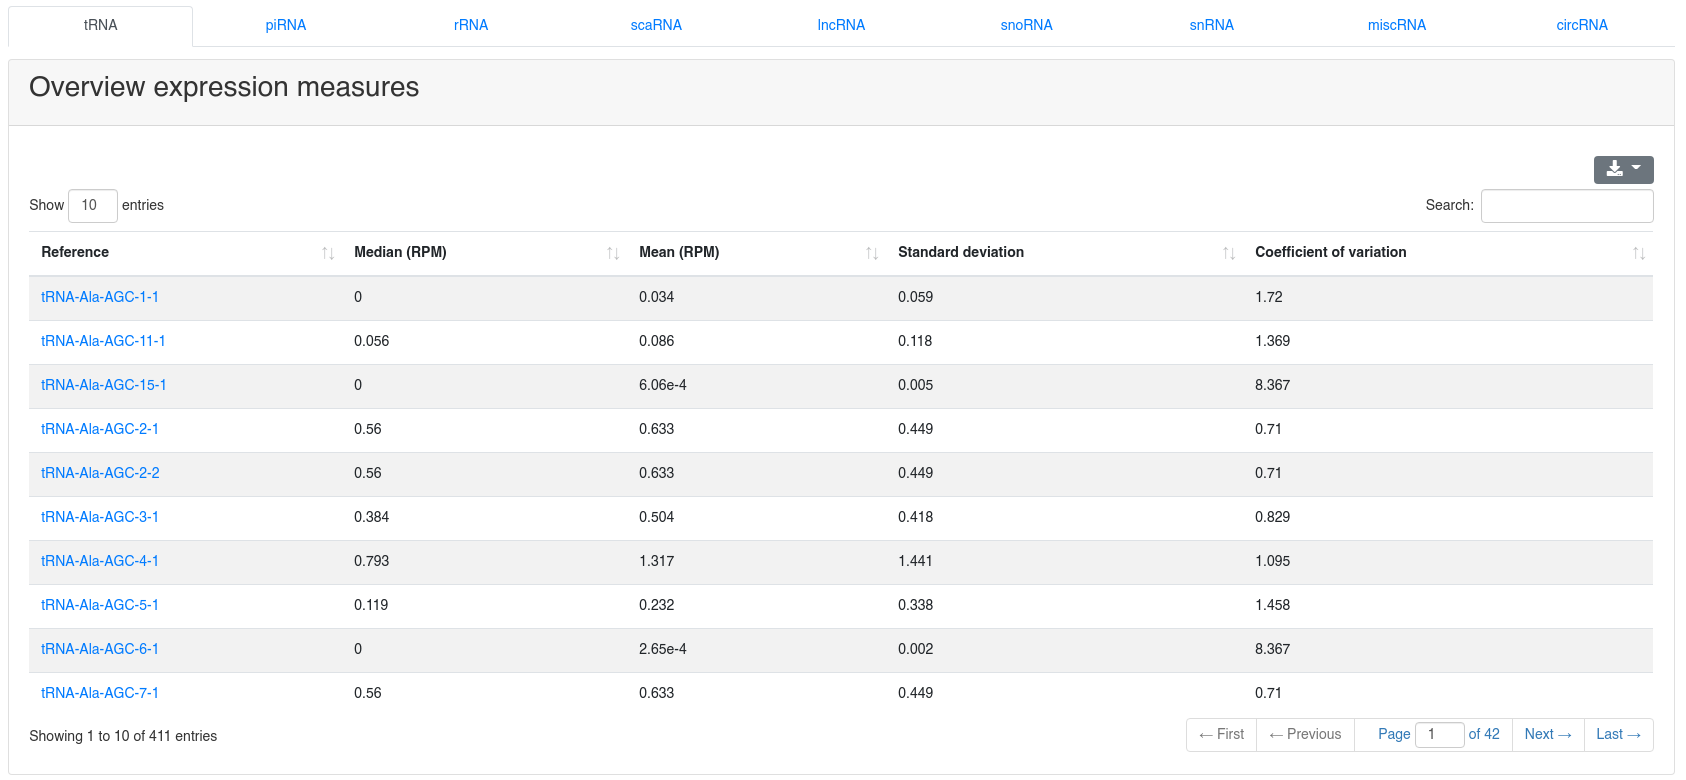
The detailed sample information table shows all expression values per sample.
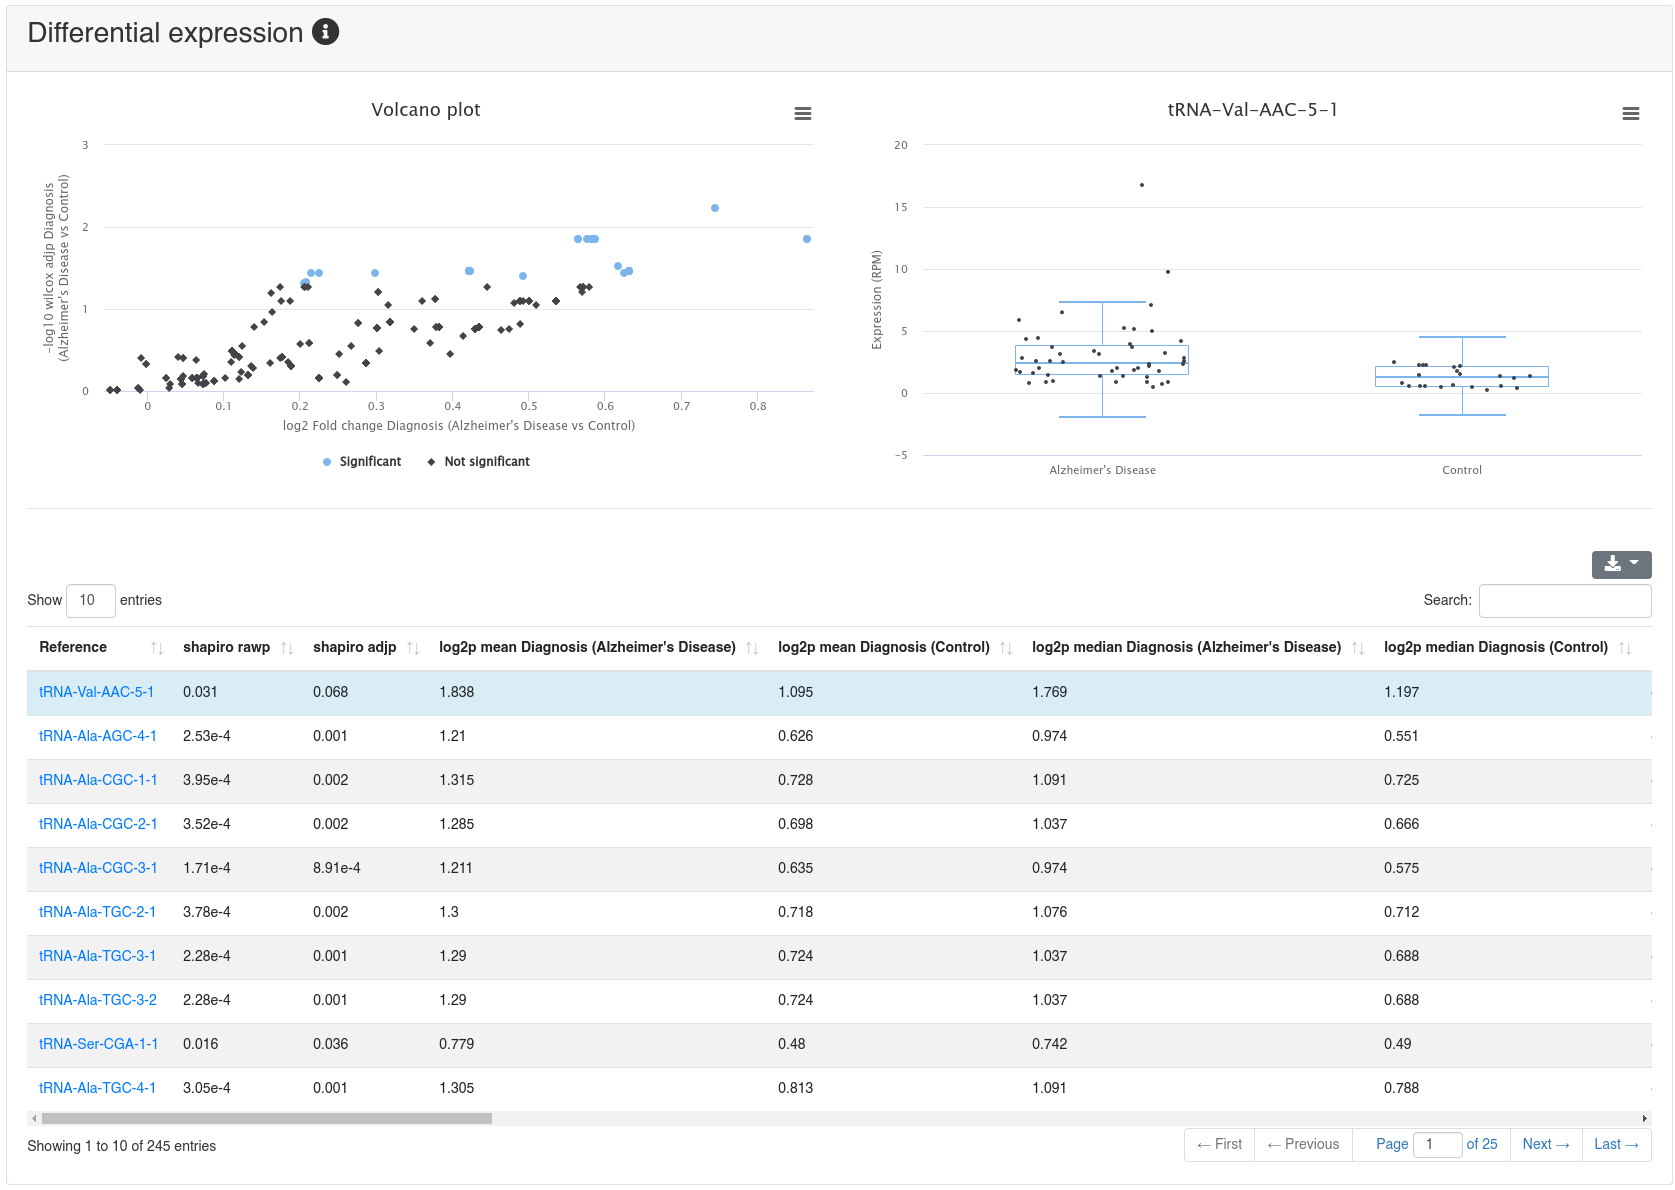
If a comparison annotation was provided a differential expression card is displayed. It shows a volcano plot highlighting all significantly differentially expressed RNAs, as well as the expression of an RNA selected in the table below as boxplot. The table contains multiple measures for the set of analysed RNAs (per default, the ones that were expressed in at least 50% of all samples of a group). Normal distribution is determined by a Shapiro-Wilk test, differential expression significance is tested via a t-test and a Wilcoxon rank sum test. All raw p-values (rawp) are reported as well as their levels after adjustment for multiple testing using the Benjamini-Hochberg procedure [6] (adjp). t-tests are run on log2p (log2 + 1) RPM transformed values. In addition the effect sizes Cohens D as well as the AUC are reported.
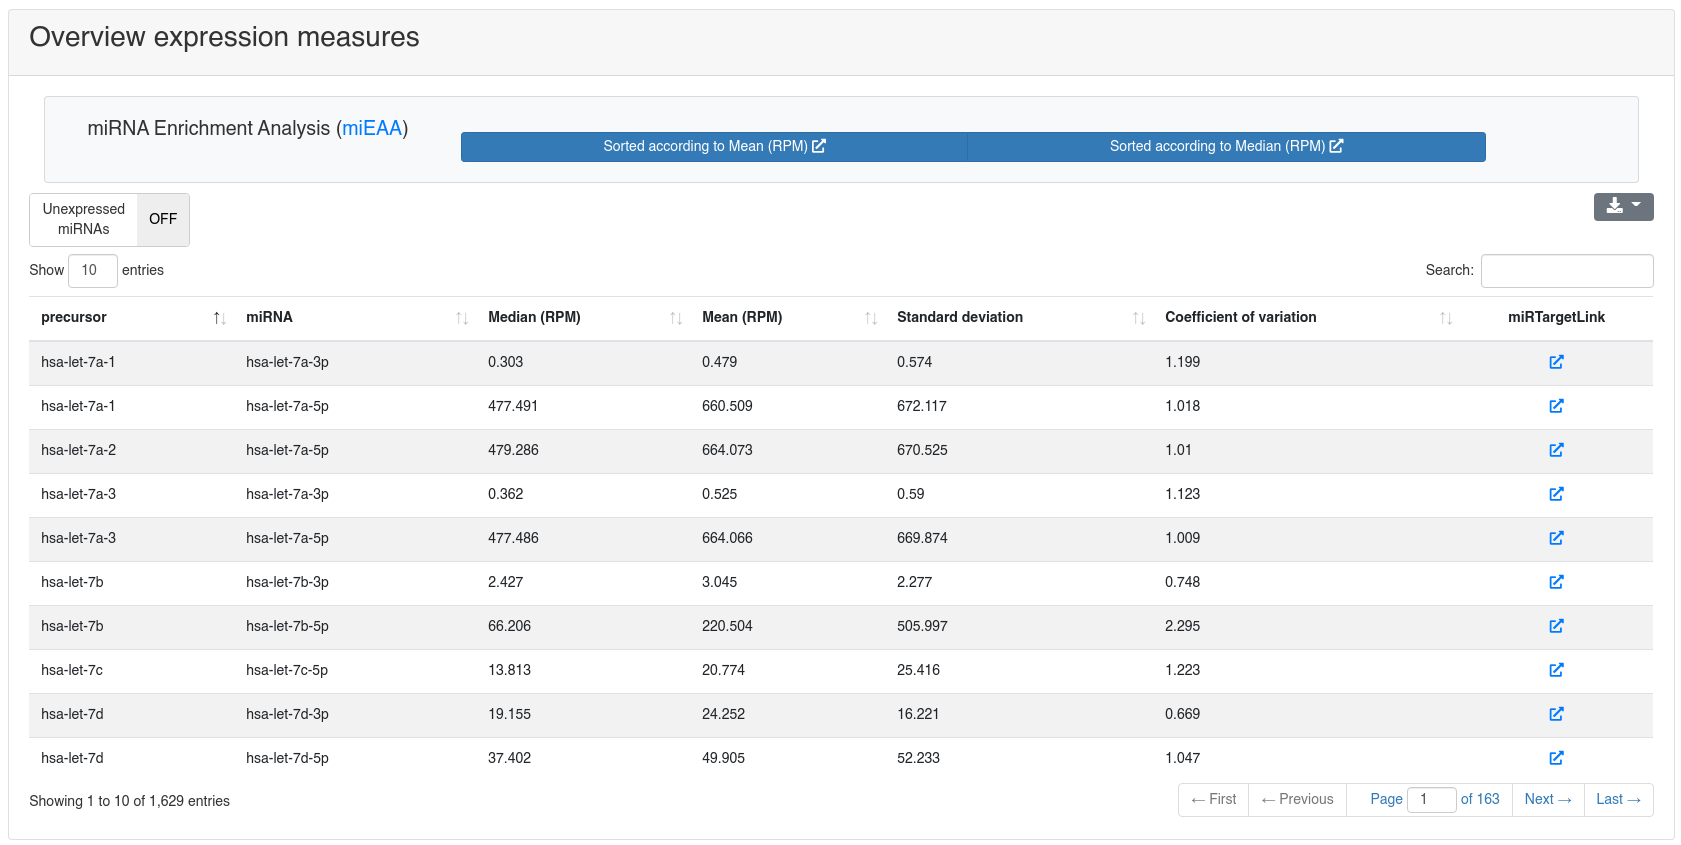
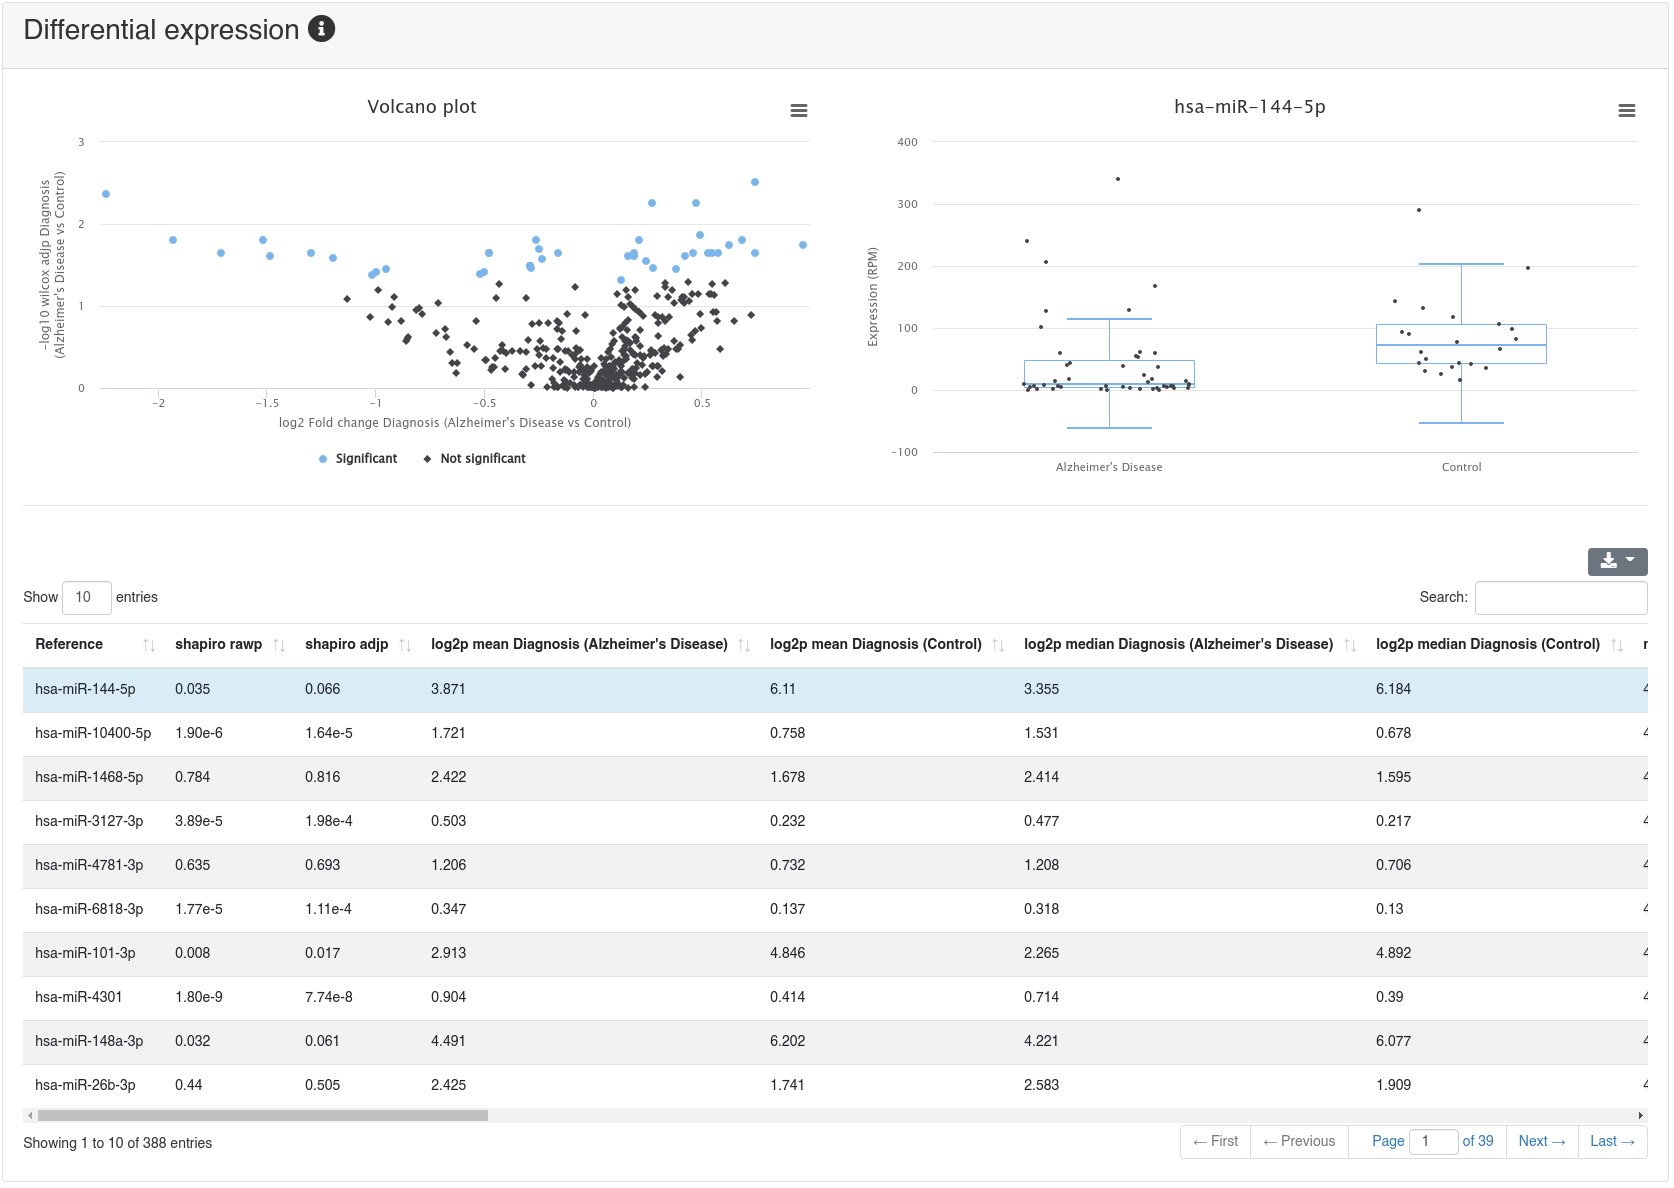
9 - Quantification miRNA
The miRNA quantification page shows the expression of all known miRNAs of miRBase v22 [1].
miRNA enrichment analysis using miEAA [4] can be performed by clicking one of the provided options in the toolbar.
The target networks of all miRNAs can be inspected by following the link to miRTargetLink2 [5] provided in the overview table for each miRNA.
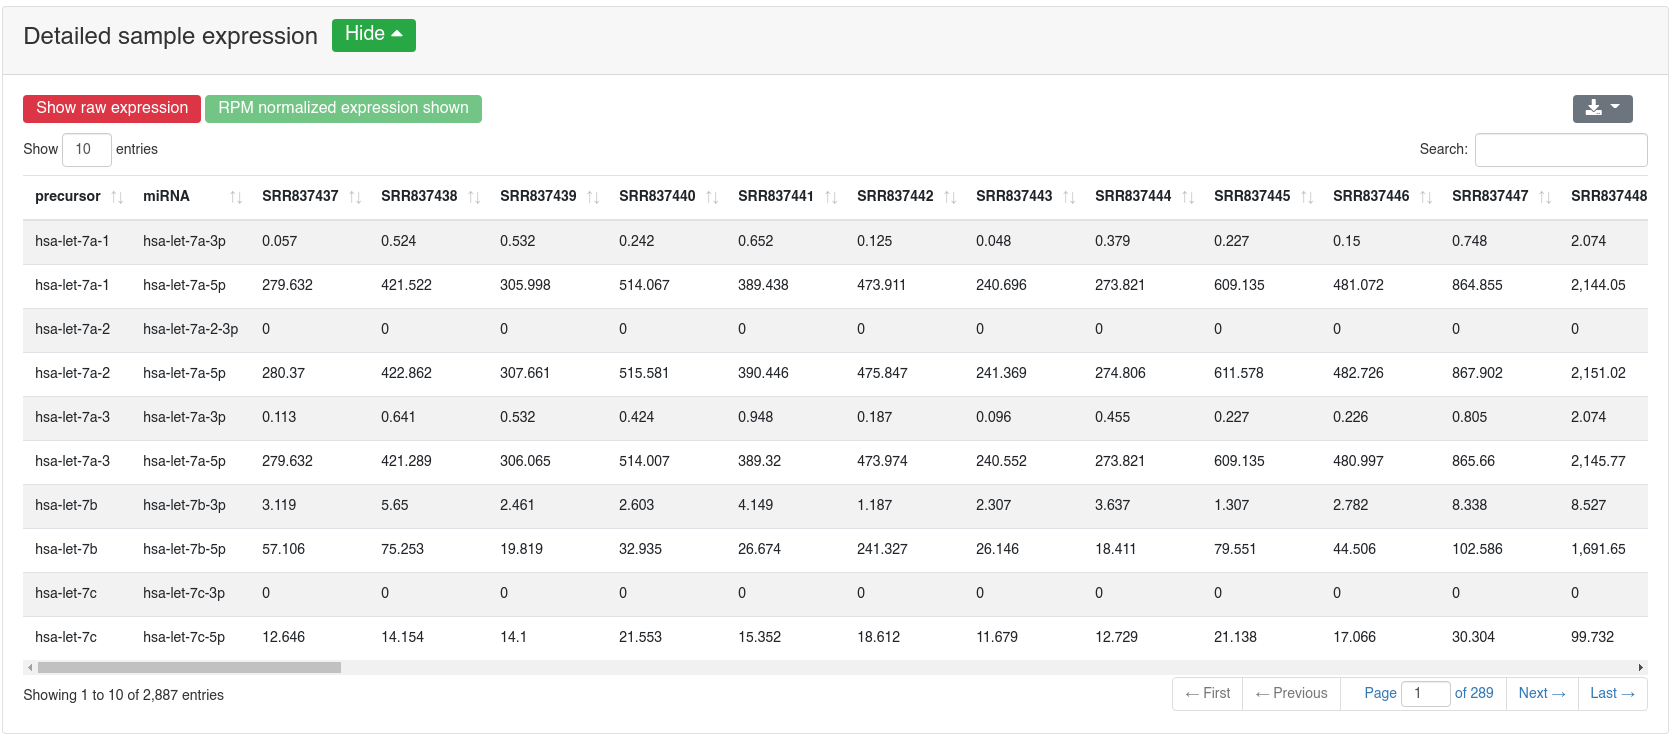
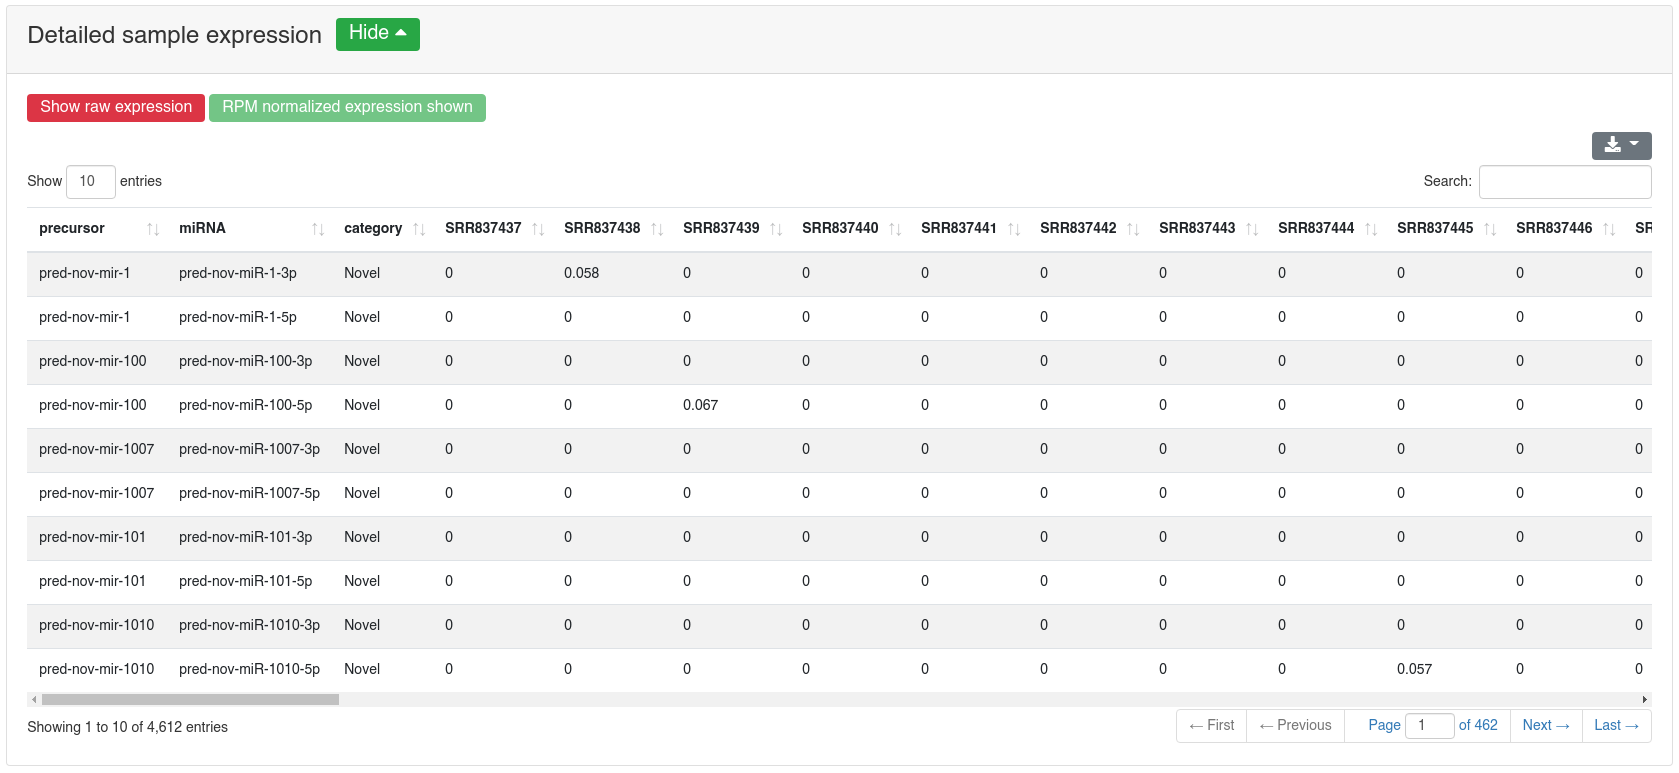
The detailed sample expression shows the expression of each miRNA in each analyzed sample. The expression can either be in RPM or alternatively the raw counts.
If a comparison annotation was provided a differential expression card is displayed. It shows a volcano plot highlighting all significantly differentially expressed RNAs, as well as the expression of an RNA selected in the table below as boxplot. The table contains multiple measures for the set of analysed RNAs (per default, the ones that were expressed in at least 50% of all samples of a group). Normal distribution is determined by a Shapiro-Wilk test, differential expression significance is tested via a t-test and a Wilcoxon rank sum test. All raw p-values (rawp) are reported as well as their levels after adjustment for multiple testing using the Benjamini-Hochberg procedure [6] (adjp). t-tests are run on log2p (log2 + 1) RPM transformed values. In addition the effect sizes Cohens D as well as the AUC are reported.
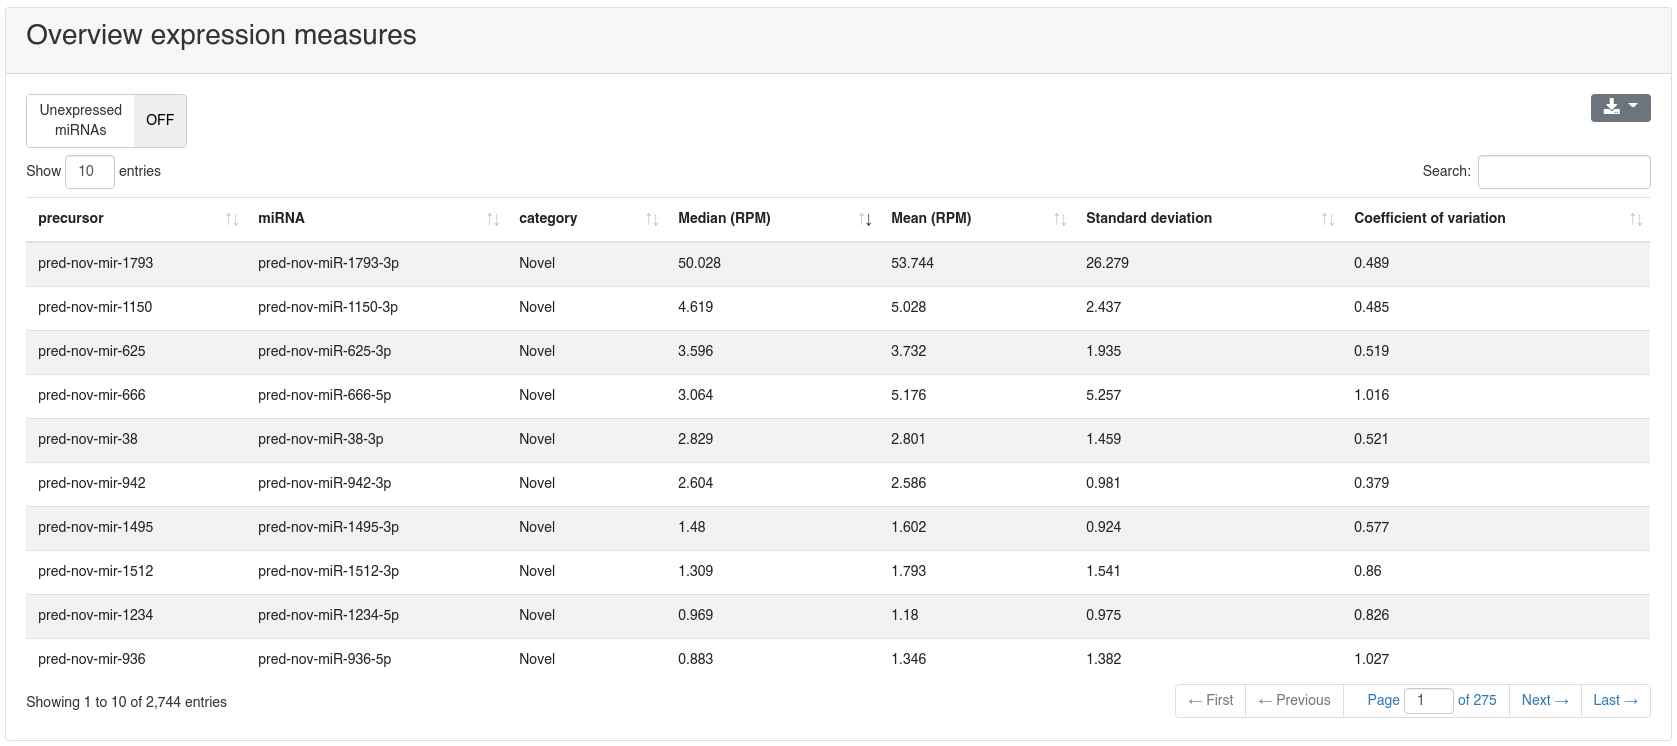
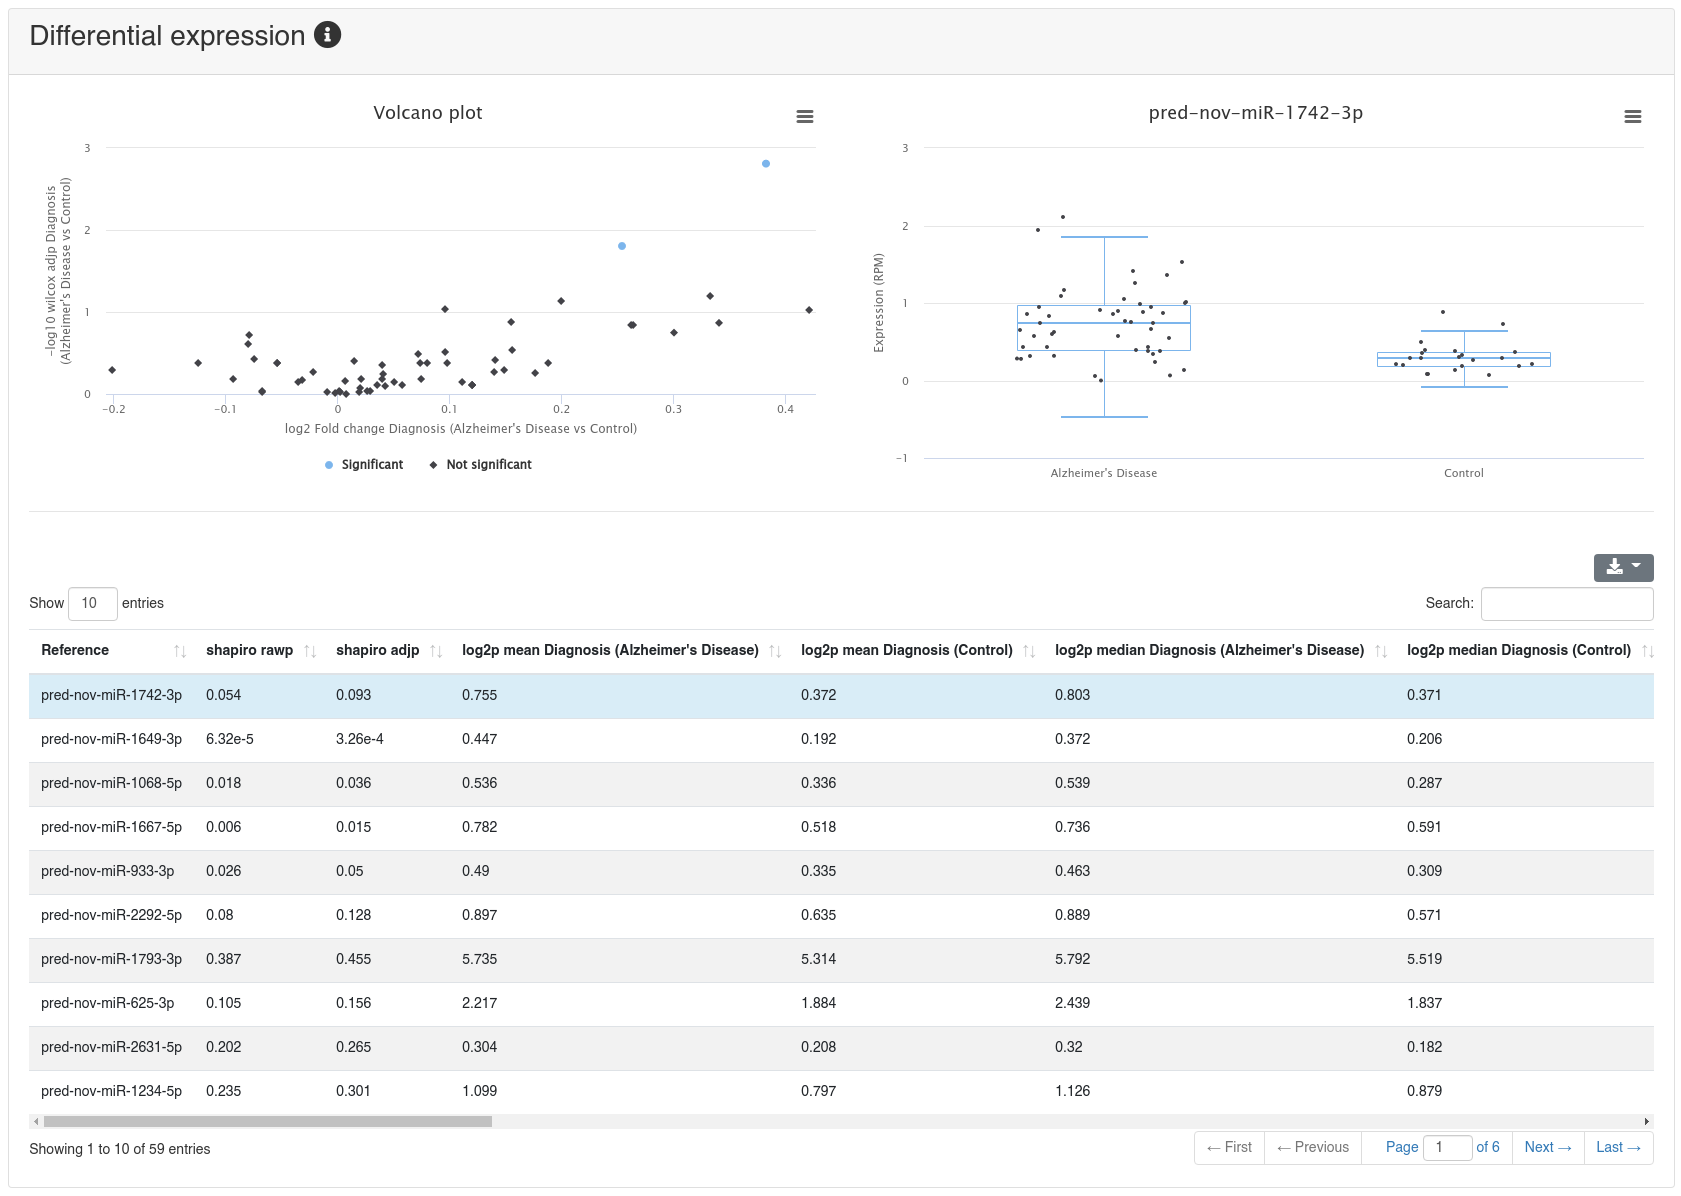
10 - Prediction
The prediction page shows all predicted precursors and their miRNAs. Each predicted precursor belongs to one of six categories:
- Known: when the prediction is overlapping with a miRBase entry and both miRNAs are overlapping with known miRNAs by at least 75%.
- Shifted known: when the prediction is only partially overlapping with miRBase and only one miRNA is overlapping by at least 75% with a known miRNA.
- One annotated: when the prediction is overlapping with a miRBase entry, but only one miRNA is annotated for that entry and this one is overlapping by at least 75% too.
- Dissimilar overlapping: when the prediction is overlapping with a miRBase entry, but the miRNAs are not overlapping with the annotated ones.
- Half novel: when the prediction is not overlapping with any miRBase entry, but contains at least 75% of one known miRNA.
- Novel: when the prediction is not overlapping with any miRBase entry and does not contain any known miRNA.
Per default only novel precursors are shown, but others can be displayed by selecting the corresponding category in the toolbar at the top of the page.

If a comparison annotation was provided a differential expression card is displayed. It shows a volcano plot highlighting all significantly differentially expressed RNAs, as well as the expression of an RNA selected in the table below as boxplot. The table contains multiple measures for the set of analysed RNAs (per default, the ones that were expressed in at least 50% of all samples of a group). Normal distribution is determined by a Shapiro-Wilk test, differential expression significance is tested via a t-test and a Wilcoxon rank sum test. All raw p-values (rawp) are reported as well as their levels after adjustment for multiple testing using the Benjamini-Hochberg procedure [6] (adjp). t-tests are run on log2p (log2 + 1) RPM transformed values. In addition the effect sizes Cohens D as well as the AUC are reported.
The detailed sample expression shows the expression of each miRNA in each analyzed sample. The expression can either be in RPM or alternatively the raw counts.
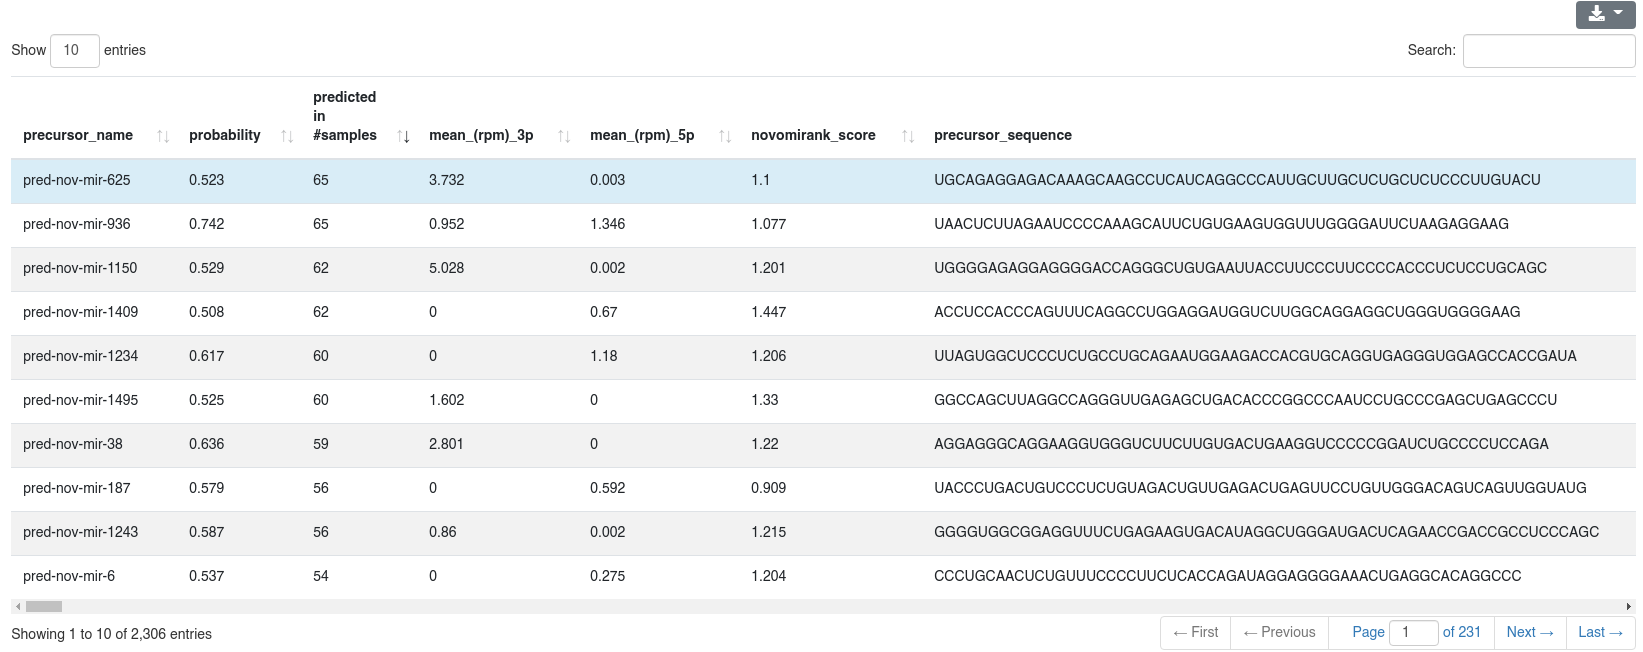
The detailed prediction information shows for each predicted precursors multiple properties.
- The precursor name
- The probability of being a true precursor
- The number of samples in which it was predicted (this can be different from the number of samples in which it is expressed)
- The mean RPM count of the 3p and 5p miRNA
- The novoMiRank score of the precursor
- The precursor sequence, secondary structure in bracket notation, 3p and 5p miRNA sequence and the genomic location
- The motifs found in the precursor. We search five different miRNA motifs: UG, UGU/GUG, CNNC [7], GHG [8], GGAC [9], while allowing matching up to two nucleotides upstream or downstream of the expected motif position.
- The precursor category
- The columns blacklist_5p and blacklist_3p show all entries from the Ensembl non-coding RNA database (release 100) [2], and all entries from NONCODE v5 with which the 5' and 3' miRNA overlap by at least 90% and differ in at most one position.
- The columns mirbase_5p and mirbase_3p show all miRNAs of miRBase v22 [1] with which the 5' and 3' miRNA overlap by at least 90% and differ in at most one position.
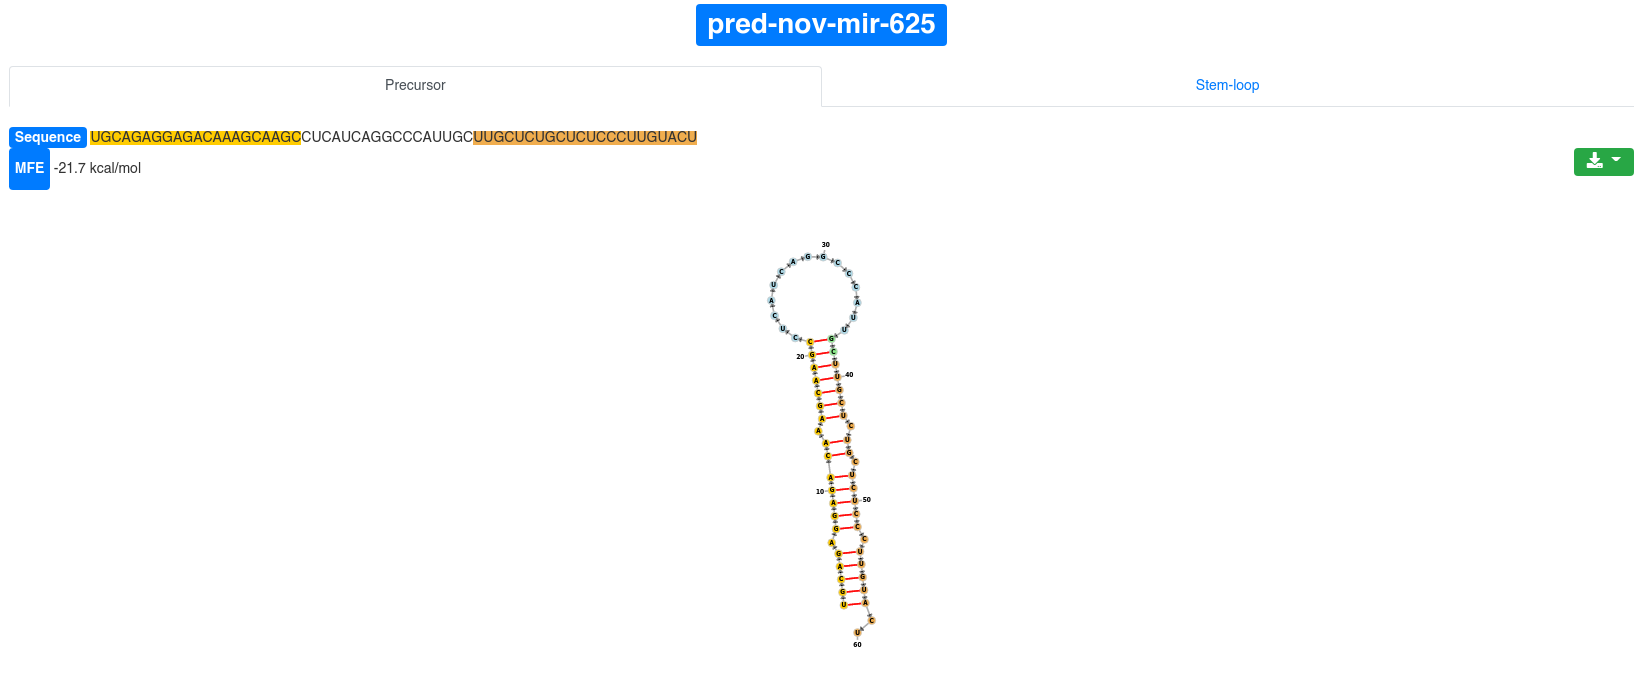
Each precursor is clickable and additional information are provided for the selected prediction. The sequence and the minimum free energy are reported, as well as the secondary structure. The additional information can be shown for the precursor sequence (determined by the start of the 5' miRNA and the end of the 3' miRNA) and also for the precursor stem-loop (15 nucleotides extension on the 5' and 3' ends).
The secondary structure nucleotides are per default colored according to the type of structure they belong to:
Green:: Stems (canonical helices)
Red: Multiloops (junctions)
Yellow: Interior loops
Blue: Hairpin loops
Orange: 5' and 3' unpaired region
The 3' and 5' miRNA are highlighted specifically as well.
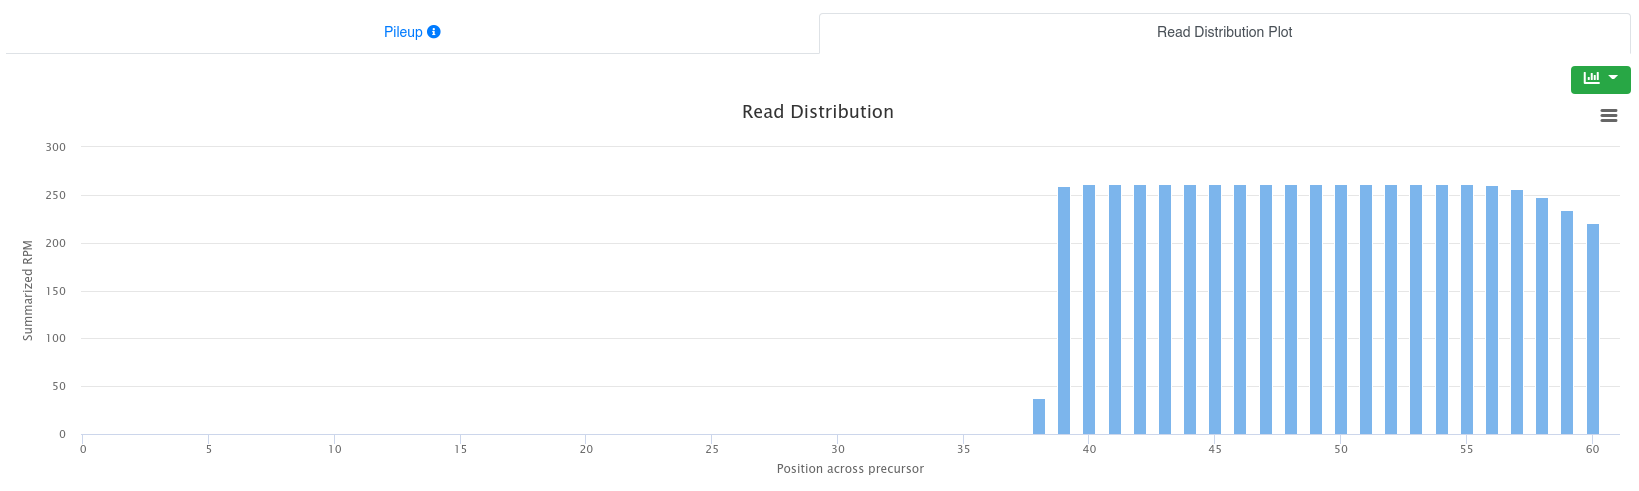
The pileup plot of the reads mapping to the precursor/stem-loop can be inspected. It can filtered according to the minimum read per million (RPM) expression of reads mapping to a position. Further the plot can be dragged and zoomed to visualize the exact sequences.

The read distribution on the precursor/stem-loop is visualized showing the total RPM of all sequences mapping at each position. The distribution plot can be displayed either as bar plot or as area plot.
Bibliography
- Kozomara, A. Birgaoanu, M., Griffiths-Jones, S. miRBase: from microRNA sequences to function Nucleic Acids Res. 47, D155-D162 (2019).
- Yates, A. et al. Ensembl 2016. Nucleic Acids Res. 44, D710–D716 (2016).
- Pruitt, K., Brown, G., Tatusova, T. & Maglott, D. The Reference Sequence ( RefSeq ) Database. NCBI Handb. 1–24 (2002).
- Kern, F., Fehlmann, T., Solomon, J., & Keller, A. miEAA 2.0: integrating multi-species microRNA enrichment analysis and workflow management systems. Nucleic Acids Res. 48, W521–W528 (2020).
- Hamberg, M. et al. MiRTargetLink--miRNAs, Genes and Interaction Networks. Int. J. Mol. Sci. 17, 564 (2016).
- Benjamini, Y. & Hochberg, Y. Controlling the False Discovery Rate : A Practical and Powerful Approach to Multiple Testing. J. R. Stat. Soc. Ser. B 57, 289–300 (1995).
- Auyeung, V. C., Ulitsky, I., McGeary, S. E. & Bartel, D. P. Beyond secondary structure: primary-sequence determinants license pri-miRNA hairpins for processing. Cell 152, 844–858 (2013).
- Fang, W. & Bartel, D. P. The Menu of Features that Define Primary MicroRNAs and Enable De Novo Design of MicroRNA Genes. Mol. Cell 60, 131–145 (2015).
- Alarcón, C. R., Lee, H., Goodarzi, H., Halberg, N. & Tavazoie, S. F. N6-methyladenosine marks primary microRNAs for processing. Nature 519, 482–5 (2015).